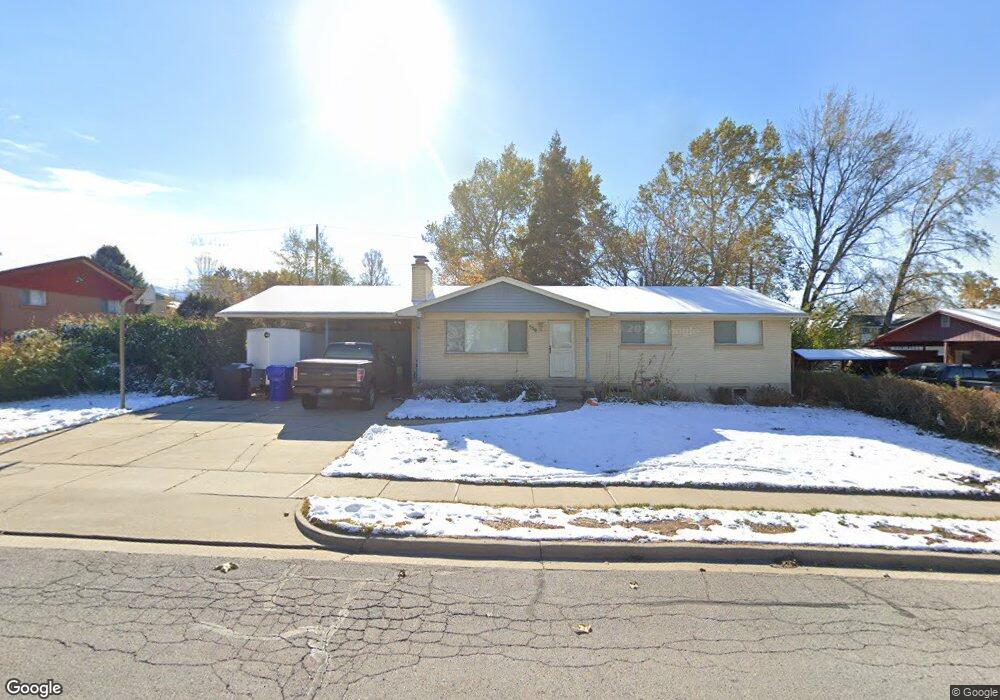
530 E 1450 N Bountiful, UT 84010
Estimated Value: $538,751 - $590,000
5
Beds
3
Baths
2,240
Sq Ft
$251/Sq Ft
Est. Value
About This Home
This home is located at 530 E 1450 N, Bountiful, UT 84010 and is currently estimated at $562,438, approximately $251 per square foot. 530 E 1450 N is a home located in Davis County with nearby schools including Tolman School, Centerville Jr High, and Viewmont High School.
Ownership History
Date
Name
Owned For
Owner Type
Purchase Details
Closed on
Nov 20, 2025
Sold by
Reier Kristen K
Bought by
Reier Family Revocable Living Trust and Reier
Current Estimated Value
Purchase Details
Closed on
Nov 19, 2019
Sold by
Reier Matthew and Patterson Kristen
Bought by
Reier Kristen K
Home Financials for this Owner
Home Financials are based on the most recent Mortgage that was taken out on this home.
Original Mortgage
$276,000
Interest Rate
3.5%
Mortgage Type
New Conventional
Purchase Details
Closed on
Aug 16, 2010
Sold by
Henderson Jayson F and Henderson Cicily
Bought by
Reier Matthew and Patterson Kristen
Home Financials for this Owner
Home Financials are based on the most recent Mortgage that was taken out on this home.
Original Mortgage
$205,186
Interest Rate
4.37%
Mortgage Type
FHA
Purchase Details
Closed on
Sep 24, 2004
Sold by
The Karene Y Higgins Trust and Higgins Karene Y
Bought by
Henderson Jayson F and Henderson Cicily
Home Financials for this Owner
Home Financials are based on the most recent Mortgage that was taken out on this home.
Original Mortgage
$161,405
Interest Rate
5.87%
Mortgage Type
Purchase Money Mortgage
Create a Home Valuation Report for This Property
The Home Valuation Report is an in-depth analysis detailing your home's value as well as a comparison with similar homes in the area
Purchase History
| Date | Buyer | Sale Price | Title Company |
|---|---|---|---|
| Reier Family Revocable Living Trust | -- | None Listed On Document | |
| Reier Kristen K | -- | Aspen Title Insurance | |
| Reier Matthew | -- | Bonneville Superior Title | |
| Henderson Jayson F | -- | Bonneville Title Company Inc |
Source: Public Records
Mortgage History
| Date | Status | Borrower | Loan Amount |
|---|---|---|---|
| Previous Owner | Reier Kristen K | $276,000 | |
| Previous Owner | Reier Matthew | $205,186 | |
| Previous Owner | Henderson Jayson F | $161,405 |
Source: Public Records
Tax History
| Year | Tax Paid | Tax Assessment Tax Assessment Total Assessment is a certain percentage of the fair market value that is determined by local assessors to be the total taxable value of land and additions on the property. | Land | Improvement |
|---|---|---|---|---|
| 2025 | $3,026 | $273,900 | $131,047 | $142,853 |
| 2024 | $2,845 | $267,300 | $120,869 | $146,431 |
| 2023 | $2,728 | $465,000 | $218,591 | $246,409 |
| 2022 | $2,887 | $270,600 | $116,318 | $154,282 |
| 2021 | $2,497 | $357,000 | $172,835 | $184,165 |
| 2020 | $2,207 | $316,000 | $157,388 | $158,612 |
| 2019 | $2,236 | $313,000 | $156,300 | $156,700 |
| 2018 | $2,079 | $286,000 | $145,021 | $140,979 |
| 2016 | $1,722 | $127,765 | $45,356 | $82,409 |
| 2015 | $1,677 | $117,425 | $45,356 | $72,069 |
| 2014 | $1,691 | $122,193 | $45,356 | $76,837 |
| 2013 | -- | $109,539 | $48,340 | $61,199 |
Source: Public Records
Map
Nearby Homes
- 610 E Pages Ln
- 662 E 1200 N
- 967 S Courtyard Ln
- 1420 N Main St
- 345 E 600 S
- 610 S 800 E
- 495 E 475 S
- 975 E 1050 N
- 16 W 780 S
- 96 Village Square Rd
- 951 Centerville Commons Way
- 1023 E 800 N
- 453 N 400 E Unit 7-D
- 1260 N 200 W
- 908 Northern Hills Dr Unit 3
- 328 E 1100 S
- 933 Northern Hills Cir
- 345 N 400 E
- 1130 N 200 W
- 1105 E 600 N
Your Personal Tour Guide
Ask me questions while you tour the home.