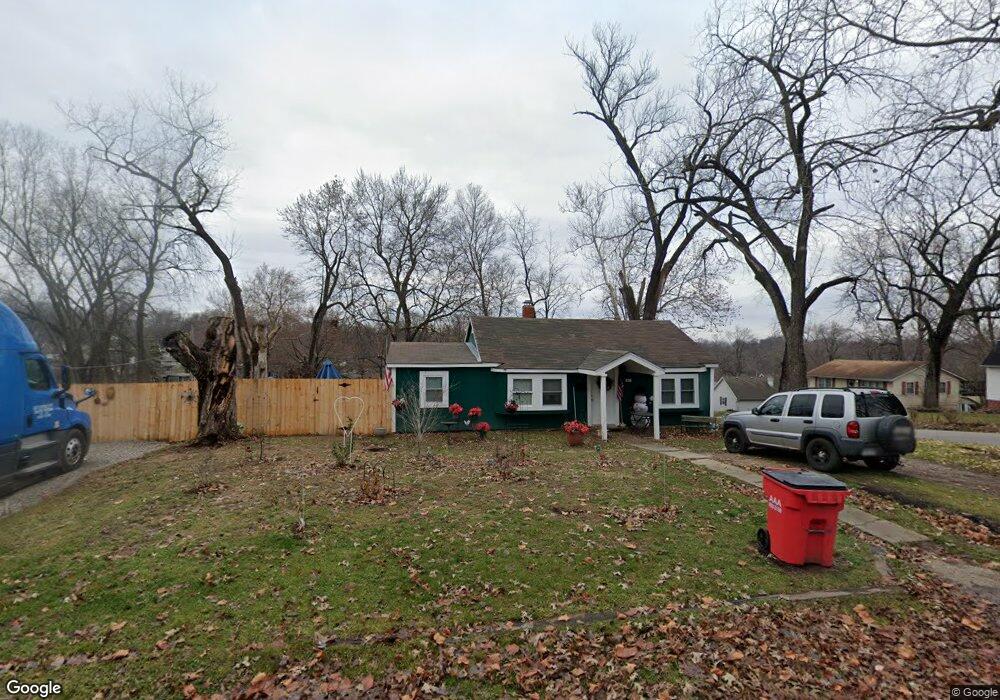
530 E Devon St Independence, MO 64055
Hanthorn NeighborhoodEstimated Value: $126,000 - $160,000
3
Beds
1
Bath
909
Sq Ft
$159/Sq Ft
Est. Value
About This Home
This home is located at 530 E Devon St, Independence, MO 64055 and is currently estimated at $144,533, approximately $159 per square foot. 530 E Devon St is a home located in Jackson County with nearby schools including Sycamore Hills Elementary School, Bridger Middle School, and Pioneer Ridge Middle School.
Ownership History
Date
Name
Owned For
Owner Type
Purchase Details
Closed on
May 4, 2011
Sold by
Bac Home Loans Servicing Lp
Bought by
Ramsey Joshua and Ramsey Mckeah
Current Estimated Value
Purchase Details
Closed on
Apr 12, 2007
Sold by
Scott Michael and Scott Amber
Bought by
Masa Marketing Llc
Purchase Details
Closed on
Dec 6, 2005
Sold by
B & P Home Investments Llc
Bought by
Scott Michael and Scott Amber
Create a Home Valuation Report for This Property
The Home Valuation Report is an in-depth analysis detailing your home's value as well as a comparison with similar homes in the area
Home Values in the Area
Average Home Value in this Area
Purchase History
| Date | Buyer | Sale Price | Title Company |
|---|---|---|---|
| Ramsey Joshua | -- | Fat | |
| Masa Marketing Llc | -- | Accommodation | |
| Scott Michael | -- | First American Title Ins Co |
Source: Public Records
Tax History
| Year | Tax Paid | Tax Assessment Tax Assessment Total Assessment is a certain percentage of the fair market value that is determined by local assessors to be the total taxable value of land and additions on the property. | Land | Improvement |
|---|---|---|---|---|
| 2025 | $1,295 | $13,568 | $4,342 | $9,226 |
| 2024 | $1,265 | $18,690 | $3,251 | $15,439 |
| 2023 | $1,265 | $18,690 | $1,740 | $16,950 |
| 2022 | $758 | $10,260 | $3,430 | $6,830 |
| 2021 | $758 | $10,260 | $3,430 | $6,830 |
| 2020 | $780 | $10,263 | $3,430 | $6,833 |
| 2019 | $767 | $10,263 | $3,430 | $6,833 |
| 2018 | $1,050 | $9,823 | $1,915 | $7,908 |
| 2016 | $758 | $9,577 | $1,957 | $7,620 |
Source: Public Records
Map
Nearby Homes
- 421 E Angus St
- 718 E Gudgell Ave
- 735 E Devon St
- 1340 S Emery Ave
- 1339 S Hocker Ave
- 603 E Myrtle St
- 660 E Red Rd
- 1402 S Dodgion Ave
- 1312 S Pearl St
- 921 E Manor Rd
- 220 E Hansen Ct
- 212 E Hansen Ct Unit 1
- 1120 S Leslie St
- 1815 & 1719 S Osage St
- 301 E Partridge Ave Unit K
- 303 E Partridge Ave Unit 39
- 912 E Stone St
- 925 S Emery St
- 930 S Leslie St
- 1954 S Lake Terrace
- 528 E Devon St Unit 528-530
- 528 E Devon St
- 526 E Devon St
- 1611 S Emery Ave
- 531 E Devon St
- 1607 S Emery Ave
- 529 E Devon St
- 524 E Devon St
- 527 E Devon St
- 529 E Hereford Ave
- 527 E Hereford Ave
- 525 1/2 E Devon St
- 525 E Devon St
- 1605 S Emery Ave
- 601 E Hereford Ave
- 525 E Hereford Ave
- 521 E Devon St
- 503 E Devon St
- 424 E Gudgell Ave
- 41 E Hereford Ave
Your Personal Tour Guide
Ask me questions while you tour the home.