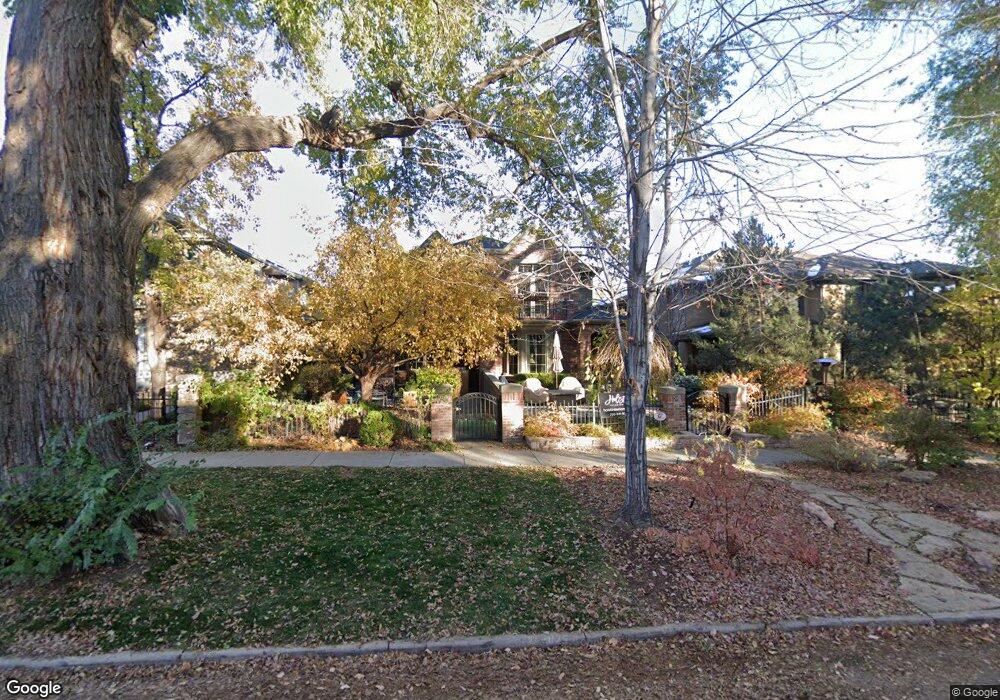
530 Garfield St Denver, CO 80206
Cherry Creek NeighborhoodEstimated Value: $1,292,652 - $1,483,000
4
Beds
4
Baths
3,420
Sq Ft
$408/Sq Ft
Est. Value
About This Home
This home is located at 530 Garfield St, Denver, CO 80206 and is currently estimated at $1,394,163, approximately $407 per square foot. 530 Garfield St is a home located in Denver County with nearby schools including Steck Elementary School, Hill Campus of Arts & Sciences, and George Washington High School.
Ownership History
Date
Name
Owned For
Owner Type
Purchase Details
Closed on
Aug 27, 2009
Sold by
Wells Fargo Bank National Association
Bought by
Jabour Dorienne
Current Estimated Value
Purchase Details
Closed on
Jul 9, 2009
Sold by
Lee Jeffery H
Bought by
Wells Fargo Bank National Association
Purchase Details
Closed on
Dec 17, 2008
Sold by
Lee Jeffrey H
Bought by
530 Garfield St Family Trust
Purchase Details
Closed on
Dec 8, 2003
Sold by
530 Garfield Street Llc
Bought by
Lee Jeffery H
Home Financials for this Owner
Home Financials are based on the most recent Mortgage that was taken out on this home.
Original Mortgage
$494,282
Interest Rate
3.6%
Mortgage Type
Balloon
Purchase Details
Closed on
Sep 13, 2002
Sold by
Proebstel Doris S and Anderson Doris S
Bought by
530 Garfield Street Llc
Home Financials for this Owner
Home Financials are based on the most recent Mortgage that was taken out on this home.
Original Mortgage
$304,500
Interest Rate
6.26%
Create a Home Valuation Report for This Property
The Home Valuation Report is an in-depth analysis detailing your home's value as well as a comparison with similar homes in the area
Home Values in the Area
Average Home Value in this Area
Purchase History
| Date | Buyer | Sale Price | Title Company |
|---|---|---|---|
| Jabour Dorienne | $578,900 | None Available | |
| Wells Fargo Bank National Association | -- | None Available | |
| 530 Garfield St Family Trust | -- | None Available | |
| Lee Jeffery H | $617,853 | Land Title | |
| 530 Garfield Street Llc | $435,000 | -- |
Source: Public Records
Mortgage History
| Date | Status | Borrower | Loan Amount |
|---|---|---|---|
| Previous Owner | Lee Jeffery H | $494,282 | |
| Previous Owner | 530 Garfield Street Llc | $304,500 |
Source: Public Records
Tax History Compared to Growth
Tax History
| Year | Tax Paid | Tax Assessment Tax Assessment Total Assessment is a certain percentage of the fair market value that is determined by local assessors to be the total taxable value of land and additions on the property. | Land | Improvement |
|---|---|---|---|---|
| 2024 | $5,595 | $77,340 | $31,320 | $46,020 |
| 2023 | $5,474 | $77,340 | $31,320 | $46,020 |
| 2022 | $6,041 | $75,960 | $44,380 | $31,580 |
| 2021 | $5,831 | $78,150 | $45,660 | $32,490 |
| 2020 | $5,181 | $69,830 | $39,430 | $30,400 |
| 2019 | $5,036 | $69,830 | $39,430 | $30,400 |
| 2018 | $5,115 | $66,110 | $35,290 | $30,820 |
| 2017 | $5,099 | $66,110 | $35,290 | $30,820 |
| 2016 | $4,968 | $60,920 | $26,825 | $34,095 |
Source: Public Records
Map
Nearby Homes
- 525 Jackson St Unit 301
- 525 Jackson St Unit 304
- 581 Garfield St
- 469 Harrison St
- 440 Monroe St
- 3540 E 5th Ave Unit C
- 417 Garfield St
- 465 Monroe St
- 538 Madison St
- 424 Jackson St
- 445 Colorado Blvd
- 409 Harrison St Unit 2
- 405 Harrison St Unit 3
- 579 Madison St
- 420 Colorado Blvd
- 445 Madison St
- 538 Cook St
- 512 Cook St
- 608 Cook St
- 411 N Madison St
- 528 Garfield St
- 524 Garfield St
- 534 Garfield St
- 522 Garfield St
- 522 Garfield St
- 510 Garfield St
- 542 Garfield St
- 533 Jackson St
- 544 Garfield St
- 535 Jackson St
- 552 Garfield St
- 3711 E 5th Ave Unit 3711
- 3707 E 5th Ave
- 3701 E 5th Ave Unit 3701
- 3707 E 5th Ave Unit 3707
- 500 Garfield St
- 525 Jackson St Unit 206
- 525 Jackson St Unit 309
- 525 Jackson St Unit 209
- 525 Jackson St