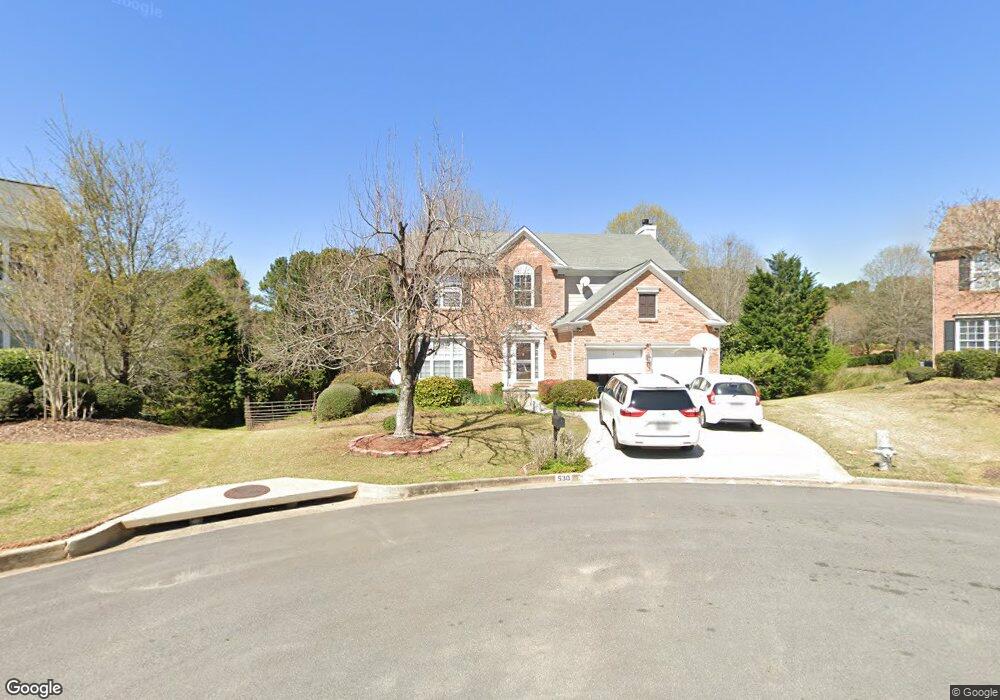
530 Grimesby Ct Unit 2 Alpharetta, GA 30005
Wellington NeighborhoodEstimated Value: $614,000 - $708,243
5
Beds
4
Baths
2,336
Sq Ft
$285/Sq Ft
Est. Value
About This Home
This home is located at 530 Grimesby Ct Unit 2, Alpharetta, GA 30005 and is currently estimated at $664,811, approximately $284 per square foot. 530 Grimesby Ct Unit 2 is a home located in Fulton County with nearby schools including Taylor Road Middle School, Chattahoochee High School, and Cresco Montessori School - Johns Creek Campus.
Ownership History
Date
Name
Owned For
Owner Type
Purchase Details
Closed on
Aug 30, 2024
Sold by
Kim Ki Hee
Bought by
Young Kang Jin
Current Estimated Value
Home Financials for this Owner
Home Financials are based on the most recent Mortgage that was taken out on this home.
Original Mortgage
$447,330
Outstanding Balance
$442,544
Interest Rate
6.73%
Mortgage Type
New Conventional
Estimated Equity
$222,267
Purchase Details
Closed on
Jun 20, 2006
Sold by
Shirgir Ashraf L
Bought by
Kim Ki H
Home Financials for this Owner
Home Financials are based on the most recent Mortgage that was taken out on this home.
Original Mortgage
$265,600
Interest Rate
8.01%
Mortgage Type
New Conventional
Purchase Details
Closed on
Nov 13, 1998
Sold by
Pulte Home Corp
Bought by
Shirgir Ashraf and Shirgir Zida
Home Financials for this Owner
Home Financials are based on the most recent Mortgage that was taken out on this home.
Original Mortgage
$144,000
Interest Rate
6.47%
Mortgage Type
New Conventional
Create a Home Valuation Report for This Property
The Home Valuation Report is an in-depth analysis detailing your home's value as well as a comparison with similar homes in the area
Home Values in the Area
Average Home Value in this Area
Purchase History
| Date | Buyer | Sale Price | Title Company |
|---|---|---|---|
| Young Kang Jin | $630,000 | -- | |
| Kim Ki H | $332,000 | -- | |
| Shirgir Ashraf | $180,000 | -- |
Source: Public Records
Mortgage History
| Date | Status | Borrower | Loan Amount |
|---|---|---|---|
| Open | Young Kang Jin | $447,330 | |
| Previous Owner | Kim Ki H | $265,600 | |
| Previous Owner | Shirgir Ashraf | $144,000 |
Source: Public Records
Tax History Compared to Growth
Tax History
| Year | Tax Paid | Tax Assessment Tax Assessment Total Assessment is a certain percentage of the fair market value that is determined by local assessors to be the total taxable value of land and additions on the property. | Land | Improvement |
|---|---|---|---|---|
| 2025 | $3,520 | $293,600 | $65,400 | $228,200 |
| 2023 | $6,483 | $229,680 | $45,120 | $184,560 |
| 2022 | $3,347 | $173,080 | $34,760 | $138,320 |
| 2021 | $3,310 | $150,680 | $30,640 | $120,040 |
| 2020 | $3,340 | $160,720 | $32,600 | $128,120 |
| 2019 | $408 | $157,880 | $32,040 | $125,840 |
| 2018 | $3,541 | $125,320 | $22,720 | $102,600 |
| 2017 | $3,255 | $107,800 | $20,480 | $87,320 |
| 2016 | $3,200 | $107,800 | $20,480 | $87,320 |
| 2015 | $3,656 | $107,800 | $20,480 | $87,320 |
| 2014 | $3,180 | $90,160 | $20,840 | $69,320 |
Source: Public Records
Map
Nearby Homes
- 230 Sessingham Ln
- 5785 Oxborough Way Unit 1
- 11915 Carriage Park Ln
- 11420 Crossington Rd
- 11800 Carriage Park Ln
- 585 Meadows Creek Dr
- 110 W Meadows Ct
- 775 Ellsborough Ct
- 7335 Lytham Trace
- 5575 Ashwind Trace
- 11615 Windbrooke Way
- 5610 N Hillbrooke Trace
- 640 Arncliffe Ct Unit 1
- 130 Wyndlam Ct
- 1660 Gladewood Dr
- 11260 Donnington Dr
- 7105 Brookwood Way
- 535 Grimesby Ct
- 535 Grimesby Ct Unit 535
- 520 Grimesby Ct
- 510 Grimesby Ct
- 525 Grimesby Ct Unit 2
- 990 Cherringham Ct Unit 1
- 980 Cherringham Ct Unit 1
- 515 Grimesby Ct
- 225 Devon Mill Ct
- 970 Cherringham Ct
- 215 Devon Downs Place
- 0 Grimesby Ct Unit 8419752
- 0 Grimesby Ct Unit 7518148
- 500 Grimesby Ct Unit 2
- 960 Cherringham Ct
- 355 Leatherman Ct
- 385 Leatherman Ct Unit 2
- 205 Devon Mill Ct Unit 2
- 235 Devon Mill Ct
- 950 Cherringham Ct Unit 1