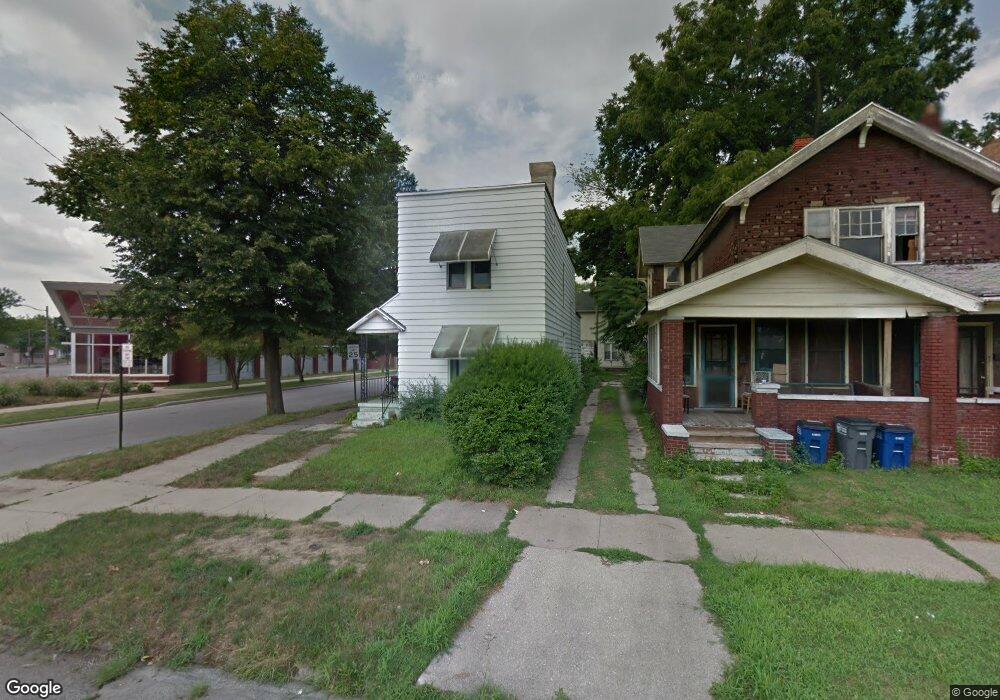
530 Langdon St Toledo, OH 43609
Southside NeighborhoodEstimated Value: $52,000 - $81,000
3
Beds
1
Bath
1,710
Sq Ft
$38/Sq Ft
Est. Value
About This Home
This home is located at 530 Langdon St, Toledo, OH 43609 and is currently estimated at $65,664, approximately $38 per square foot. 530 Langdon St is a home located in Lucas County with nearby schools including Marshall Stemm Academy, Jesup W. Scott High School, and Summit Academy - Toledo.
Ownership History
Date
Name
Owned For
Owner Type
Purchase Details
Closed on
Aug 17, 2020
Sold by
Ohnson Dorian J and Ohnson Dorian J
Bought by
D & D Restoratioin Llc
Current Estimated Value
Purchase Details
Closed on
Jul 18, 2019
Sold by
Murphy James E
Bought by
Johnson Dorian J
Purchase Details
Closed on
Apr 23, 2019
Sold by
Sifuentes Pete and Sifuentes Karen K
Bought by
Murphy James E
Purchase Details
Closed on
Aug 3, 2000
Sold by
Sifuentes Josefa G
Bought by
Sifuentes Pete
Purchase Details
Closed on
Sep 27, 1991
Sold by
Sifuentes F G and J G
Create a Home Valuation Report for This Property
The Home Valuation Report is an in-depth analysis detailing your home's value as well as a comparison with similar homes in the area
Home Values in the Area
Average Home Value in this Area
Purchase History
| Date | Buyer | Sale Price | Title Company |
|---|---|---|---|
| D & D Restoratioin Llc | -- | None Available | |
| Johnson Dorian J | $1,500 | None Available | |
| Murphy James E | $300 | None Available | |
| Sifuentes Pete | -- | -- | |
| -- | -- | -- |
Source: Public Records
Tax History Compared to Growth
Tax History
| Year | Tax Paid | Tax Assessment Tax Assessment Total Assessment is a certain percentage of the fair market value that is determined by local assessors to be the total taxable value of land and additions on the property. | Land | Improvement |
|---|---|---|---|---|
| 2024 | $3,795 | $7,280 | $2,030 | $5,250 |
| 2023 | $656 | $6,020 | $665 | $5,355 |
| 2022 | $583 | $6,020 | $665 | $5,355 |
| 2021 | $581 | $6,020 | $665 | $5,355 |
| 2020 | $619 | $5,600 | $630 | $4,970 |
| 2019 | $601 | $5,600 | $630 | $4,970 |
| 2018 | $580 | $5,600 | $630 | $4,970 |
| 2017 | $547 | $4,550 | $1,330 | $3,220 |
| 2016 | $560 | $13,000 | $3,800 | $9,200 |
| 2015 | $557 | $13,000 | $3,800 | $9,200 |
| 2014 | $294 | $4,550 | $1,330 | $3,220 |
| 2013 | $294 | $4,550 | $1,330 | $3,220 |
Source: Public Records
Map
Nearby Homes