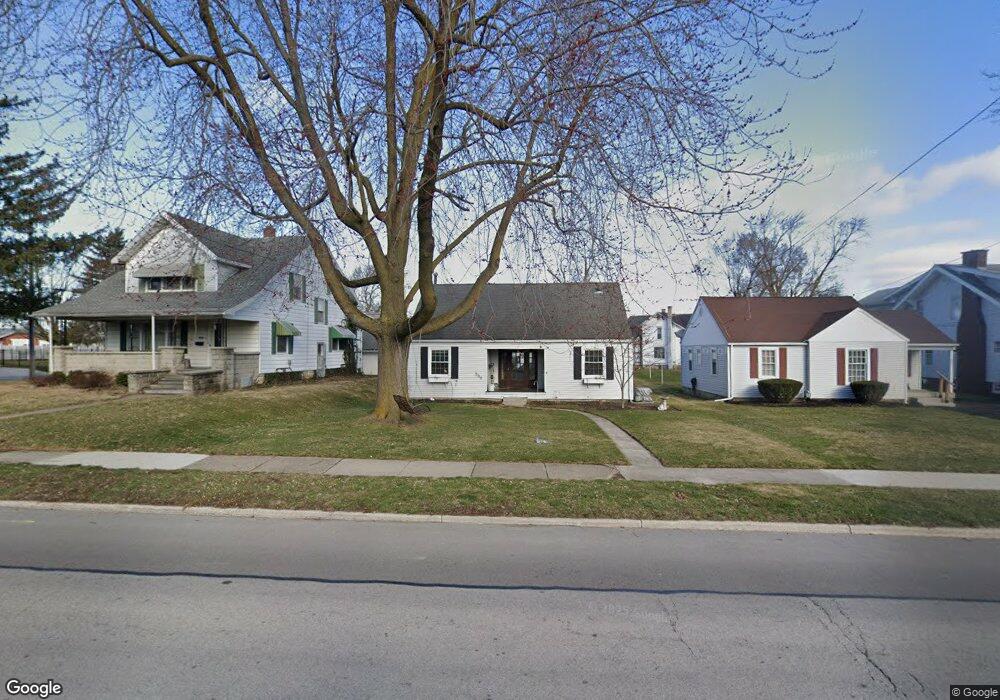
530 Lima Ave Findlay, OH 45840
Estimated Value: $151,000 - $168,000
3
Beds
2
Baths
1,158
Sq Ft
$137/Sq Ft
Est. Value
About This Home
This home is located at 530 Lima Ave, Findlay, OH 45840 and is currently estimated at $158,172, approximately $136 per square foot. 530 Lima Ave is a home located in Hancock County with nearby schools including Lincoln Elementary School, Donnell Middle School, and Findlay High School.
Ownership History
Date
Name
Owned For
Owner Type
Purchase Details
Closed on
Feb 14, 2008
Sold by
Romero Joey A and Romero Shelley L
Bought by
Shoemaker Brandon M and Burris Christen N
Current Estimated Value
Home Financials for this Owner
Home Financials are based on the most recent Mortgage that was taken out on this home.
Original Mortgage
$73,841
Outstanding Balance
$46,699
Interest Rate
6.11%
Mortgage Type
FHA
Estimated Equity
$111,474
Purchase Details
Closed on
Nov 20, 2003
Sold by
Miller Cynthia A
Bought by
Romero Joey A and Romero Shelley L
Home Financials for this Owner
Home Financials are based on the most recent Mortgage that was taken out on this home.
Original Mortgage
$77,200
Interest Rate
4.87%
Mortgage Type
Unknown
Create a Home Valuation Report for This Property
The Home Valuation Report is an in-depth analysis detailing your home's value as well as a comparison with similar homes in the area
Home Values in the Area
Average Home Value in this Area
Purchase History
| Date | Buyer | Sale Price | Title Company |
|---|---|---|---|
| Shoemaker Brandon M | $75,000 | Golden Key Title | |
| Romero Joey A | $77,200 | Whitman Title |
Source: Public Records
Mortgage History
| Date | Status | Borrower | Loan Amount |
|---|---|---|---|
| Open | Shoemaker Brandon M | $73,841 | |
| Closed | Romero Joey A | $77,200 |
Source: Public Records
Tax History Compared to Growth
Tax History
| Year | Tax Paid | Tax Assessment Tax Assessment Total Assessment is a certain percentage of the fair market value that is determined by local assessors to be the total taxable value of land and additions on the property. | Land | Improvement |
|---|---|---|---|---|
| 2024 | $1,298 | $36,520 | $5,600 | $30,920 |
| 2023 | $1,300 | $36,520 | $5,600 | $30,920 |
| 2022 | $1,295 | $36,520 | $5,600 | $30,920 |
| 2021 | $963 | $23,660 | $5,730 | $17,930 |
| 2020 | $963 | $23,660 | $5,730 | $17,930 |
| 2019 | $943 | $23,660 | $5,730 | $17,930 |
| 2018 | $828 | $19,050 | $4,590 | $14,460 |
| 2017 | $414 | $19,050 | $4,590 | $14,460 |
| 2016 | $828 | $19,050 | $4,590 | $14,460 |
| 2015 | $659 | $15,060 | $4,400 | $10,660 |
| 2014 | $659 | $15,060 | $4,400 | $10,660 |
| 2012 | $664 | $15,060 | $4,400 | $10,660 |
Source: Public Records
Map
Nearby Homes