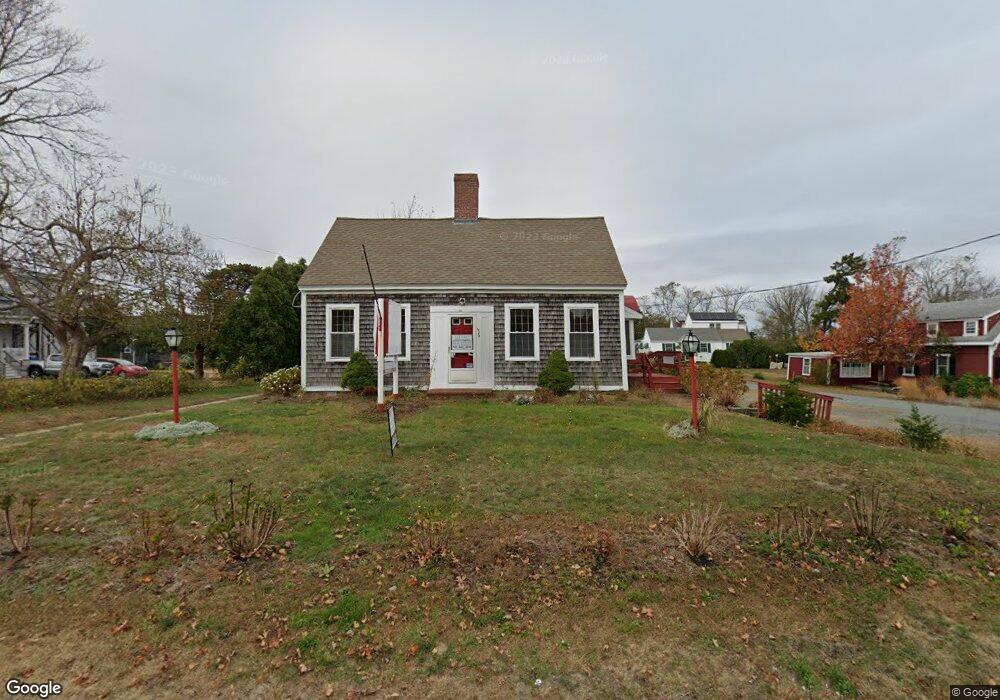
530 Main St West Dennis, MA 2670
West Dennis NeighborhoodEstimated Value: $635,174
1
Bed
3
Baths
680
Sq Ft
$934/Sq Ft
Est. Value
About This Home
This home is located at 530 Main St, West Dennis, MA 2670 and is currently estimated at $635,174, approximately $934 per square foot. 530 Main St is a home located in Barnstable County with nearby schools including Dennis-Yarmouth Regional High School and St. Pius X. School.
Ownership History
Date
Name
Owned For
Owner Type
Purchase Details
Closed on
Mar 29, 2023
Sold by
Sunray 112 Llc
Bought by
Sunray 530 Llc
Current Estimated Value
Home Financials for this Owner
Home Financials are based on the most recent Mortgage that was taken out on this home.
Original Mortgage
$500,000
Outstanding Balance
$484,284
Interest Rate
6.32%
Mortgage Type
Construction
Estimated Equity
$150,890
Purchase Details
Closed on
Mar 10, 2021
Sold by
530 Main St Llc
Bought by
Sunray 112 Llc
Create a Home Valuation Report for This Property
The Home Valuation Report is an in-depth analysis detailing your home's value as well as a comparison with similar homes in the area
Home Values in the Area
Average Home Value in this Area
Purchase History
| Date | Buyer | Sale Price | Title Company |
|---|---|---|---|
| Sunray 530 Llc | -- | None Available | |
| Sunray 530 Llc | -- | None Available | |
| Sunray 112 Llc | $439,900 | None Available | |
| Sunray 112 Llc | $439,900 | None Available |
Source: Public Records
Mortgage History
| Date | Status | Borrower | Loan Amount |
|---|---|---|---|
| Open | Sunray 530 Llc | $500,000 | |
| Closed | Sunray 530 Llc | $500,000 |
Source: Public Records
Property History
| Date | Event | Price | List to Sale | Price per Sq Ft |
|---|---|---|---|---|
| 10/08/2024 10/08/24 | Off Market | $1,900 | -- | -- |
| 09/01/2024 09/01/24 | For Rent | $1,900 | -- | -- |
Tax History Compared to Growth
Tax History
| Year | Tax Paid | Tax Assessment Tax Assessment Total Assessment is a certain percentage of the fair market value that is determined by local assessors to be the total taxable value of land and additions on the property. | Land | Improvement |
|---|---|---|---|---|
| 2025 | $2,778 | $641,600 | $310,200 | $331,400 |
| 2024 | $2,033 | $463,200 | $299,000 | $164,200 |
| 2023 | $2,262 | $484,400 | $284,700 | $199,700 |
| 2022 | $2,555 | $456,300 | $268,600 | $187,700 |
| 2021 | $2,685 | $445,300 | $263,300 | $182,000 |
| 2020 | $2,238 | $366,900 | $189,300 | $177,600 |
| 2019 | $2,253 | $365,200 | $189,300 | $175,900 |
| 2018 | $2,256 | $355,900 | $189,300 | $166,600 |
| 2017 | $2,189 | $355,900 | $189,300 | $166,600 |
| 2016 | $2,287 | $350,200 | $189,300 | $160,900 |
Source: Public Records
Map
Nearby Homes
- 428 Main St Unit 1-11
- 467 Main St
- 401 Main St Unit 201
- 401 Main St Unit 101
- 15 Woodside Park Rd
- 61 Trotters Ln
- 3 Pinefield Ln
- 23 Doric Ave
- 26 Center St
- 209 Main St Unit 3
- 209 Main St Unit 6
- 209 Main St Unit 1
- 209 Main St Unit 2
- 209 Main St Unit 4
- 209 Main St Unit 5
- 178 School St
- 14 Schoolhouse Ln
- 95 Center St
- 27 Mayflower Ln
- 80 Michaels Ave
- 530 Main St Unit 2
- 530 Main St Unit 4
- 530 Massachusetts 28 Unit 1 & 2
- 530 Massachusetts 28
- 540 Main St
- 520 Main St Unit 6A
- 520 Main St Unit 1A
- 520 Main St Unit 6
- 520 Main St Unit 5
- 520 Main St Unit 4
- 520 Main St Unit 3
- 520 Main St Unit 2
- 520 Main St Unit 1
- 520 Main St Unit 6A
- 520 Main St Unit 5A
- 520 Main St Unit 2A
- 520 Main St Unit 4A
- 520 Main St
- 520 Main St Unit 1A
- 520 Main St Unit 2A