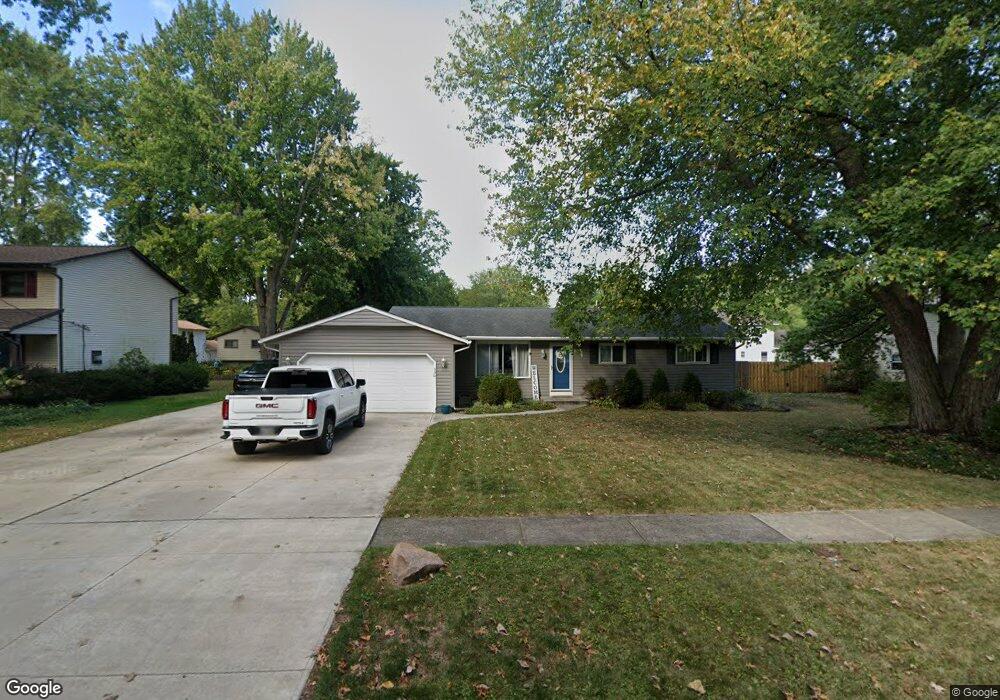
530 Maple Ave Sheffield Lake, OH 44054
Estimated Value: $261,434 - $287,000
3
Beds
2
Baths
1,520
Sq Ft
$177/Sq Ft
Est. Value
About This Home
This home is located at 530 Maple Ave, Sheffield Lake, OH 44054 and is currently estimated at $269,109, approximately $177 per square foot. 530 Maple Ave is a home located in Lorain County with nearby schools including Knollwood Elementary School, Brookside Intermediate School, and Brookside Middle School.
Ownership History
Date
Name
Owned For
Owner Type
Purchase Details
Closed on
Aug 29, 2023
Sold by
Cook Preservation Trust
Bought by
Ackerman Timothy D
Current Estimated Value
Home Financials for this Owner
Home Financials are based on the most recent Mortgage that was taken out on this home.
Original Mortgage
$218,500
Outstanding Balance
$213,278
Interest Rate
6.78%
Mortgage Type
New Conventional
Estimated Equity
$55,831
Purchase Details
Closed on
Jun 14, 2022
Sold by
Cook John K and Cook Linda A
Bought by
Cook Preservation Trust
Purchase Details
Closed on
Feb 18, 2021
Sold by
Cook John K and Burns Linda A
Bought by
Cook John K and Cook Linda A
Create a Home Valuation Report for This Property
The Home Valuation Report is an in-depth analysis detailing your home's value as well as a comparison with similar homes in the area
Home Values in the Area
Average Home Value in this Area
Purchase History
| Date | Buyer | Sale Price | Title Company |
|---|---|---|---|
| Ackerman Timothy D | $230,000 | Network Land Title | |
| Cook Preservation Trust | -- | Cooper Adel Vu & Associates Lp | |
| Cook John K | -- | None Available |
Source: Public Records
Mortgage History
| Date | Status | Borrower | Loan Amount |
|---|---|---|---|
| Open | Ackerman Timothy D | $218,500 |
Source: Public Records
Tax History Compared to Growth
Tax History
| Year | Tax Paid | Tax Assessment Tax Assessment Total Assessment is a certain percentage of the fair market value that is determined by local assessors to be the total taxable value of land and additions on the property. | Land | Improvement |
|---|---|---|---|---|
| 2024 | $3,767 | $72,356 | $13,458 | $58,898 |
| 2023 | $2,383 | $49,413 | $10,721 | $38,693 |
| 2022 | $2,385 | $49,413 | $10,721 | $38,693 |
| 2021 | $2,399 | $49,413 | $10,721 | $38,693 |
| 2020 | $2,102 | $41,350 | $8,970 | $32,380 |
| 2019 | $2,651 | $41,350 | $8,970 | $32,380 |
| 2018 | $2,751 | $41,350 | $8,970 | $32,380 |
| 2017 | $2,841 | $40,240 | $9,290 | $30,950 |
| 2016 | $2,867 | $40,240 | $9,290 | $30,950 |
| 2015 | $2,830 | $40,240 | $9,290 | $30,950 |
| 2014 | $2,480 | $38,870 | $8,970 | $29,900 |
| 2013 | $2,468 | $38,870 | $8,970 | $29,900 |
Source: Public Records
Map
Nearby Homes
- 0 Woodruff Dr
- 560 Elm St
- 524 Irving Park Blvd
- 280 Buckeye Dr Unit 5
- 326 Abbe Rd N
- 0 Sheffield Dr
- 552 Treadway Blvd
- 630 Treadway Blvd
- 518 Lafayette Blvd
- 689 Lafayette Blvd
- 5365 E Lake Rd
- 762 Maplewood Ave
- 738 W Shore Blvd
- 580 Alameda Ave
- VL Maplewood Ave
- 0 E Lake Rd
- 4502 Edgewater Dr
- 33803 Electric Blvd Unit D15
- 33803 Electric Blvd Unit H17
- 640 Pasadena Ave