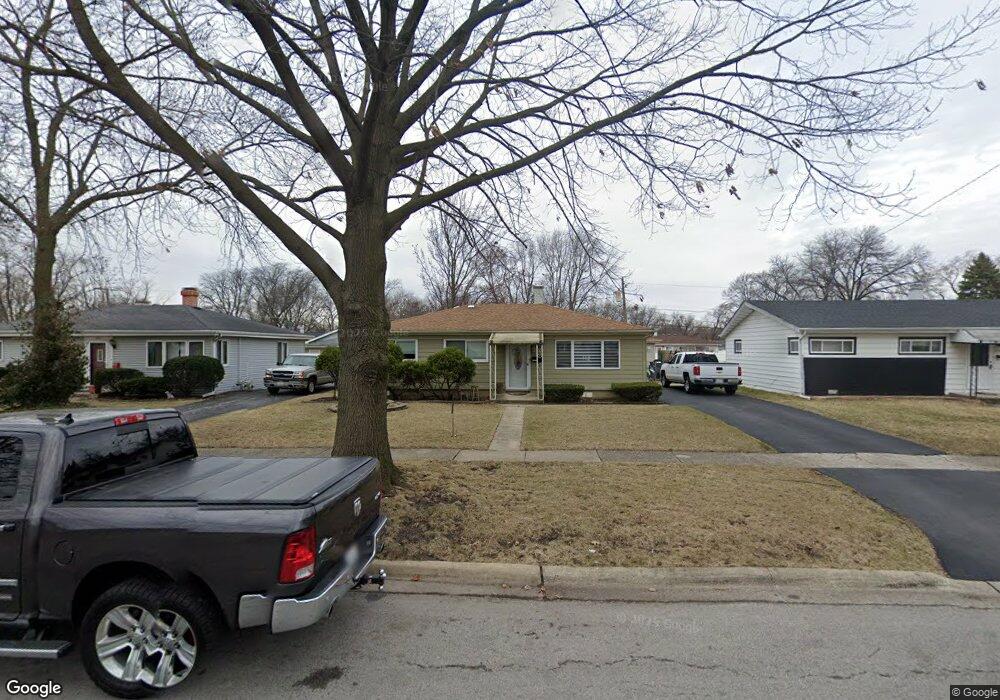
530 N 2nd Ave Villa Park, IL 60181
Estimated Value: $264,911 - $346,000
--
Bed
--
Bath
1,073
Sq Ft
$299/Sq Ft
Est. Value
About This Home
This home is located at 530 N 2nd Ave, Villa Park, IL 60181 and is currently estimated at $320,478, approximately $298 per square foot. 530 N 2nd Ave is a home located in DuPage County with nearby schools including Schafer Elementary School, Jefferson Middle School, and Willowbrook High School.
Ownership History
Date
Name
Owned For
Owner Type
Purchase Details
Closed on
Dec 11, 2012
Sold by
Boulahanis Christopher N
Bought by
Boulahanis Gina
Current Estimated Value
Purchase Details
Closed on
Oct 6, 2002
Sold by
Boulahanis Peggy A and Boulahanis Peggy
Bought by
Boulahanis Gina R and Boulahanis Gina
Home Financials for this Owner
Home Financials are based on the most recent Mortgage that was taken out on this home.
Original Mortgage
$100,400
Outstanding Balance
$38,512
Interest Rate
5%
Estimated Equity
$281,966
Purchase Details
Closed on
Jan 26, 1999
Sold by
Benbrook Paul
Bought by
Boulahanis Gina and Boulahanis Peggy
Home Financials for this Owner
Home Financials are based on the most recent Mortgage that was taken out on this home.
Original Mortgage
$100,125
Interest Rate
6.87%
Purchase Details
Closed on
Jan 25, 1999
Sold by
Benbrook James M and Benbrook Jeffrey
Bought by
Benbrook Paul
Home Financials for this Owner
Home Financials are based on the most recent Mortgage that was taken out on this home.
Original Mortgage
$100,125
Interest Rate
6.87%
Purchase Details
Closed on
Dec 21, 1995
Sold by
Mccarty Ruth and Smith Linda S
Bought by
Benbrook Paul and Kosinski Susan
Create a Home Valuation Report for This Property
The Home Valuation Report is an in-depth analysis detailing your home's value as well as a comparison with similar homes in the area
Home Values in the Area
Average Home Value in this Area
Purchase History
| Date | Buyer | Sale Price | Title Company |
|---|---|---|---|
| Boulahanis Gina | -- | None Available | |
| Boulahanis Gina R | -- | -- | |
| Boulahanis Gina | $133,500 | First American Title Ins | |
| Benbrook Paul | -- | First American Title Ins | |
| Benbrook Paul | $98,000 | -- |
Source: Public Records
Mortgage History
| Date | Status | Borrower | Loan Amount |
|---|---|---|---|
| Open | Boulahanis Gina R | $100,400 | |
| Closed | Boulahanis Gina | $100,125 |
Source: Public Records
Tax History Compared to Growth
Tax History
| Year | Tax Paid | Tax Assessment Tax Assessment Total Assessment is a certain percentage of the fair market value that is determined by local assessors to be the total taxable value of land and additions on the property. | Land | Improvement |
|---|---|---|---|---|
| 2024 | $5,043 | $74,725 | $12,782 | $61,943 |
| 2023 | $4,784 | $69,100 | $11,820 | $57,280 |
| 2022 | $4,698 | $66,420 | $11,360 | $55,060 |
| 2021 | $4,502 | $64,770 | $11,080 | $53,690 |
| 2020 | $4,391 | $63,350 | $10,840 | $52,510 |
| 2019 | $4,091 | $60,230 | $10,310 | $49,920 |
| 2018 | $3,798 | $53,280 | $9,120 | $44,160 |
| 2017 | $3,696 | $50,770 | $8,690 | $42,080 |
| 2016 | $3,579 | $47,830 | $8,190 | $39,640 |
| 2015 | $3,513 | $44,560 | $7,630 | $36,930 |
| 2014 | $4,396 | $54,450 | $15,220 | $39,230 |
| 2013 | $4,192 | $55,210 | $15,430 | $39,780 |
Source: Public Records
Map
Nearby Homes
- 739 N 2nd Ave
- 700 W Pleasant St
- 417 W Terrace St
- 434 N Lincoln Ave
- 439 N Harvard Ave
- 2N152 Wisconsin Ave
- 37 N Addison Rd
- 933 W North Ave Unit A
- 131 N Chase Ave
- 2N000 Vista Ave
- 912 E Saint Charles Rd
- 490 N Chatham Ave
- 247 N Ardmore Ave
- 921 S Iowa Ave
- 935 E Saint Charles Rd
- 913 S Iowa Ave
- 235 N Ardmore Ave
- 439 N Fairfield Ave
- 736 E Saint Charles Rd
- 530 N Fairfield Ave
- 526 N 2nd Ave
- 536 N 2nd Ave
- 540 N 2nd Ave
- 529 N Bierman Ave
- 522 N 2nd Ave
- 535 N Bierman Ave
- 525 N Bierman Ave
- 539 N Bierman Ave
- 546 N 2nd Ave
- 521 N Bierman Ave
- 518 N 2nd Ave
- 535 N 2nd Ave
- 529 N 2nd Ave
- 525 N 2nd Ave
- 517 N Biermann Ave
- 545 N Bierman Ave
- 517 N Bierman Ave
- 521 N 2nd Ave
- 539 N 2nd Ave
- 550 N 2nd Ave