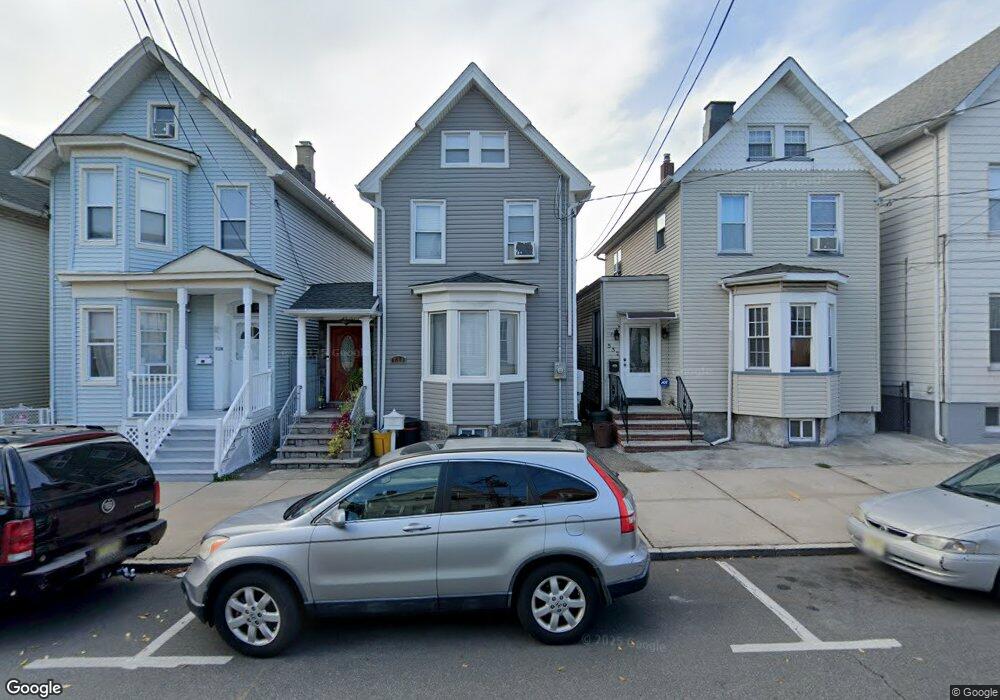
530 N 3rd St East Newark, NJ 07029
Estimated Value: $393,000 - $515,000
--
Bed
--
Bath
1,687
Sq Ft
$272/Sq Ft
Est. Value
About This Home
This home is located at 530 N 3rd St, East Newark, NJ 07029 and is currently estimated at $458,460, approximately $271 per square foot. 530 N 3rd St is a home located in Hudson County with nearby schools including East Newark Public School, Kearny Christian Academy, and Marwah Academy.
Ownership History
Date
Name
Owned For
Owner Type
Purchase Details
Closed on
Dec 29, 1995
Sold by
Tague Hugh and Tague Kathryn
Bought by
Perim Gerson and Perim Maria Das Gracas
Current Estimated Value
Home Financials for this Owner
Home Financials are based on the most recent Mortgage that was taken out on this home.
Original Mortgage
$84,000
Outstanding Balance
$2,271
Interest Rate
7.31%
Estimated Equity
$456,189
Purchase Details
Closed on
Jan 13, 1994
Sold by
Tague Hugh
Bought by
Tague Kathryn and Tague H
Home Financials for this Owner
Home Financials are based on the most recent Mortgage that was taken out on this home.
Original Mortgage
$80,000
Interest Rate
7.08%
Purchase Details
Closed on
Aug 17, 1977
Bought by
Perim Gerson and Perim Maria
Create a Home Valuation Report for This Property
The Home Valuation Report is an in-depth analysis detailing your home's value as well as a comparison with similar homes in the area
Home Values in the Area
Average Home Value in this Area
Purchase History
| Date | Buyer | Sale Price | Title Company |
|---|---|---|---|
| Perim Gerson | $91,000 | -- | |
| Tague Kathryn | $100,000 | -- | |
| Perim Gerson | $30,000 | -- |
Source: Public Records
Mortgage History
| Date | Status | Borrower | Loan Amount |
|---|---|---|---|
| Open | Perim Gerson | $84,000 | |
| Previous Owner | Tague Kathryn | $80,000 |
Source: Public Records
Tax History Compared to Growth
Tax History
| Year | Tax Paid | Tax Assessment Tax Assessment Total Assessment is a certain percentage of the fair market value that is determined by local assessors to be the total taxable value of land and additions on the property. | Land | Improvement |
|---|---|---|---|---|
| 2025 | $6,317 | $213,200 | $62,500 | $150,700 |
| 2024 | $5,993 | $213,200 | $62,500 | $150,700 |
| 2023 | $5,993 | $213,200 | $62,500 | $150,700 |
| 2022 | $5,822 | $213,200 | $62,500 | $150,700 |
| 2021 | $5,793 | $213,200 | $62,500 | $150,700 |
| 2020 | $5,558 | $213,200 | $62,500 | $150,700 |
| 2019 | $5,560 | $213,200 | $62,500 | $150,700 |
| 2018 | $5,452 | $213,200 | $62,500 | $150,700 |
| 2017 | $5,402 | $213,200 | $62,500 | $150,700 |
| 2016 | $5,759 | $62,400 | $15,000 | $47,400 |
| 2015 | $5,656 | $62,400 | $15,000 | $47,400 |
| 2014 | $5,687 | $62,400 | $15,000 | $47,400 |
Source: Public Records
Map
Nearby Homes