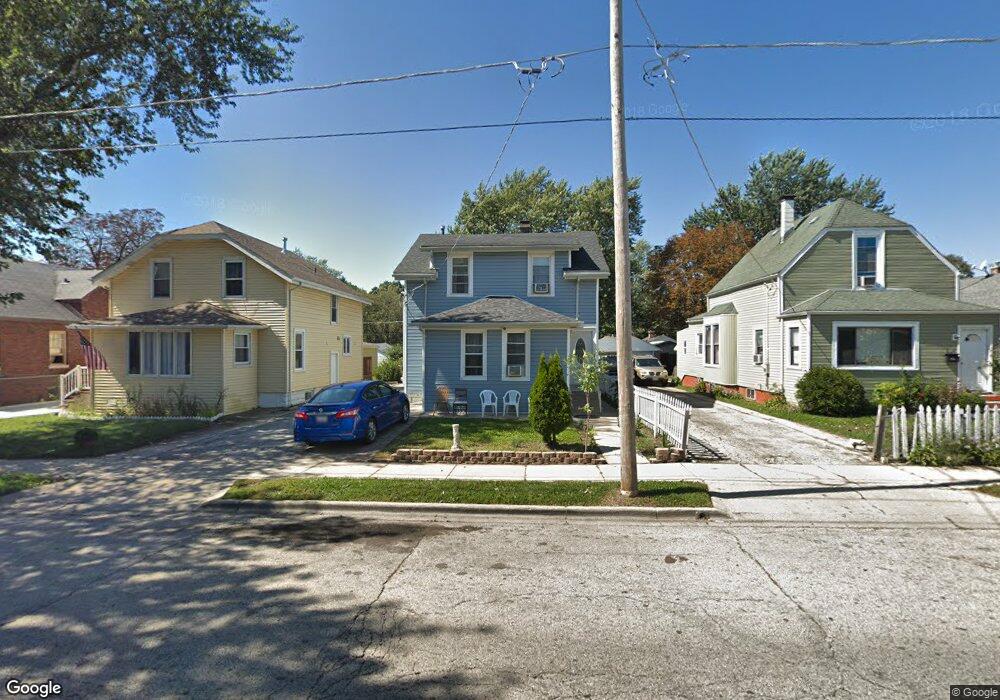
530 N Butrick St Waukegan, IL 60085
Pine Trail Estates NeighborhoodEstimated Value: $162,000 - $226,000
3
Beds
2
Baths
1,392
Sq Ft
$138/Sq Ft
Est. Value
About This Home
This home is located at 530 N Butrick St, Waukegan, IL 60085 and is currently estimated at $192,597, approximately $138 per square foot. 530 N Butrick St is a home located in Lake County with nearby schools including Hyde Park Elementary School, Miguel Juarez Middle School, and Waukegan High School.
Ownership History
Date
Name
Owned For
Owner Type
Purchase Details
Closed on
Jun 9, 2020
Sold by
Landeros Gilberto
Bought by
Chavez Andy Jair and Chavez Cristian Joel
Current Estimated Value
Purchase Details
Closed on
Mar 16, 2011
Sold by
Federal National Mortgage Association
Bought by
Landeros Gilberto
Purchase Details
Closed on
Sep 23, 2010
Sold by
Buentello Eulalia
Bought by
Federal National Mortgage Association
Purchase Details
Closed on
Jul 28, 2006
Sold by
Garcia Valdemar and Buentello Maria
Bought by
Buentello Eulalia
Home Financials for this Owner
Home Financials are based on the most recent Mortgage that was taken out on this home.
Original Mortgage
$115,600
Interest Rate
6.77%
Mortgage Type
Commercial
Purchase Details
Closed on
Apr 8, 1998
Sold by
Marquina Francisco and Marquina Apoloniah
Bought by
Garcia Valdemar and Buentello Maria
Home Financials for this Owner
Home Financials are based on the most recent Mortgage that was taken out on this home.
Original Mortgage
$89,213
Interest Rate
7.26%
Mortgage Type
FHA
Create a Home Valuation Report for This Property
The Home Valuation Report is an in-depth analysis detailing your home's value as well as a comparison with similar homes in the area
Home Values in the Area
Average Home Value in this Area
Purchase History
| Date | Buyer | Sale Price | Title Company |
|---|---|---|---|
| Chavez Andy Jair | -- | Fidelity National Ttl Ins Co | |
| Landeros Gilberto | $28,500 | Attorneys Title Guaranty Fun | |
| Federal National Mortgage Association | -- | None Available | |
| Buentello Eulalia | $144,500 | None Available | |
| Garcia Valdemar | $90,000 | First American Title |
Source: Public Records
Mortgage History
| Date | Status | Borrower | Loan Amount |
|---|---|---|---|
| Previous Owner | Buentello Eulalia | $115,600 | |
| Previous Owner | Garcia Valdemar | $89,213 |
Source: Public Records
Tax History Compared to Growth
Tax History
| Year | Tax Paid | Tax Assessment Tax Assessment Total Assessment is a certain percentage of the fair market value that is determined by local assessors to be the total taxable value of land and additions on the property. | Land | Improvement |
|---|---|---|---|---|
| 2024 | $3,212 | $46,987 | $7,045 | $39,942 |
| 2023 | $3,630 | $42,067 | $6,307 | $35,760 |
| 2022 | $3,630 | $43,133 | $5,749 | $37,384 |
| 2021 | $3,417 | $38,774 | $5,416 | $33,358 |
| 2020 | $3,415 | $36,123 | $5,046 | $31,077 |
| 2019 | $3,384 | $33,101 | $4,624 | $28,477 |
| 2018 | $2,894 | $28,761 | $5,454 | $23,307 |
| 2017 | $2,787 | $25,445 | $4,825 | $20,620 |
| 2016 | $2,490 | $22,111 | $4,193 | $17,918 |
| 2015 | $2,329 | $19,790 | $3,753 | $16,037 |
| 2014 | $1,225 | $7,238 | $3,577 | $3,661 |
| 2012 | $273 | $7,843 | $3,876 | $3,967 |
Source: Public Records
Map
Nearby Homes
- 509 N Butrick St
- 824 N Butrick St
- 1109 Massena Ave
- 511 Chestnut St
- 917 N Linden Ave
- 522 N Poplar St
- 428 N Poplar St
- 1000 Pine St
- 702 Franklin St
- 620 N Poplar St
- 1213 Grand Ave
- 968 Judge Ave
- 1416 Hamilton Ct
- 23 N Jackson St
- 2115 Lydia St
- 1005 N Lewis Ave
- 1023 N Elmwood Ave
- 1105 Woodlawn Cir
- 1117 Judge Ave
- 615 Tiffany Dr
- 526 N Butrick St
- 534 N Butrick St
- 524 N Butrick St
- 536 N Butrick St
- 540 N Butrick St
- 533 Yeoman St
- 529 Yeoman St
- 537 Yeoman St
- 525 Yeoman St
- 604 N Butrick St
- 539 Yeoman St
- 535 N Butrick St
- 533 N Butrick St
- 514 N Butrick St
- 539 N Butrick St
- 531 N Butrick St
- 545 Yeoman St
- 608 N Butrick St
- 543 N Butrick St
- 529 N Butrick St