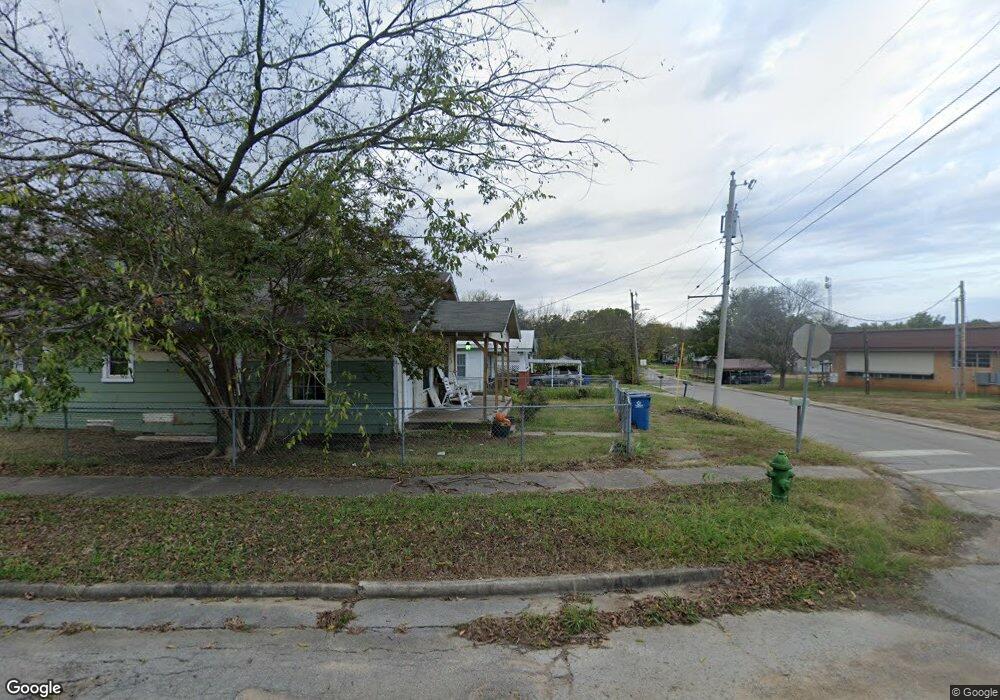
530 N E St McAlester, OK 74501
Estimated Value: $58,000 - $89,000
3
Beds
2
Baths
1,120
Sq Ft
$61/Sq Ft
Est. Value
About This Home
This home is located at 530 N E St, McAlester, OK 74501 and is currently estimated at $68,522, approximately $61 per square foot. 530 N E St is a home located in Pittsburg County with nearby schools including McAlester High School, Mcalester Christian Academy, and McAlester Christian Academy.
Ownership History
Date
Name
Owned For
Owner Type
Purchase Details
Closed on
Jun 16, 2017
Sold by
Kelley Randy P and Hill Belinda
Bought by
Mcmurtrey Frankie Ray and Mcmurtrey Traci
Current Estimated Value
Purchase Details
Closed on
Oct 30, 2015
Sold by
Hill Ashley M
Bought by
Kelley Randy P and Hill Belinda
Purchase Details
Closed on
Dec 12, 2012
Sold by
Secretary O F Hud
Bought by
Hill Ashley M
Purchase Details
Closed on
Aug 12, 2008
Sold by
Taylor Judy and Taylor Judy L
Bought by
Beauchamp Christopher L and Beauchamp Amanda J
Home Financials for this Owner
Home Financials are based on the most recent Mortgage that was taken out on this home.
Original Mortgage
$57,396
Interest Rate
6.38%
Mortgage Type
FHA
Purchase Details
Closed on
Jan 25, 2001
Sold by
Haggard Judy
Bought by
Murguia Noe
Purchase Details
Closed on
Dec 14, 1998
Sold by
Crafts
Bought by
Haggard
Create a Home Valuation Report for This Property
The Home Valuation Report is an in-depth analysis detailing your home's value as well as a comparison with similar homes in the area
Purchase History
| Date | Buyer | Sale Price | Title Company |
|---|---|---|---|
| Mcmurtrey Frankie Ray | $17,000 | None Available | |
| Kelley Randy P | -- | None Available | |
| Hill Ashley M | -- | Heartland Title And Closing | |
| Beauchamp Christopher L | $58,000 | None Available | |
| Murguia Noe | $40,000 | -- | |
| Haggard | $21,000 | -- |
Source: Public Records
Mortgage History
| Date | Status | Borrower | Loan Amount |
|---|---|---|---|
| Previous Owner | Beauchamp Christopher L | $57,396 | |
| Closed | Mcmurtrey Frankie Ray | $0 |
Source: Public Records
Tax History
| Year | Tax Paid | Tax Assessment Tax Assessment Total Assessment is a certain percentage of the fair market value that is determined by local assessors to be the total taxable value of land and additions on the property. | Land | Improvement |
|---|---|---|---|---|
| 2025 | $339 | $3,859 | $750 | $3,109 |
| 2024 | $339 | $4,112 | $750 | $3,362 |
| 2023 | $361 | $4,796 | $750 | $4,046 |
| 2022 | $420 | $4,796 | $750 | $4,046 |
| 2021 | $417 | $4,796 | $750 | $4,046 |
| 2020 | $411 | $4,692 | $750 | $3,942 |
| 2019 | $360 | $4,469 | $750 | $3,719 |
| 2018 | $350 | $4,330 | $750 | $3,580 |
| 2017 | $352 | $4,325 | $745 | $3,580 |
| 2016 | $334 | $4,119 | $539 | $3,580 |
| 2015 | $217 | $3,923 | $343 | $3,580 |
| 2014 | $400 | $6,380 | $343 | $6,037 |
Source: Public Records
Map
Nearby Homes
- 609 N C St
- 415 W Adams Ave
- 610 W Washington Ave
- 607 W Carl Albert Pkwy
- 621 W Carl Albert Pkwy
- 611 N Hickory St
- 0 Oklahoma 31 Unit 2550110
- 0 Oklahoma 31 Unit 2543194
- 802 W Adams Ave
- 321 W Adams Ave
- 740 W Washington Ave
- 0 Monroe Rd Unit 2548049
- 209 W Jefferson Ave
- 233 W Adams Ave
- 233 W Madison Ave
- 1015 N D St
- 060 Oklahoma 31
- 220 W Washington
- 213 W Monroe Ave
- 711 W Tyler Ave
Your Personal Tour Guide
Ask me questions while you tour the home.