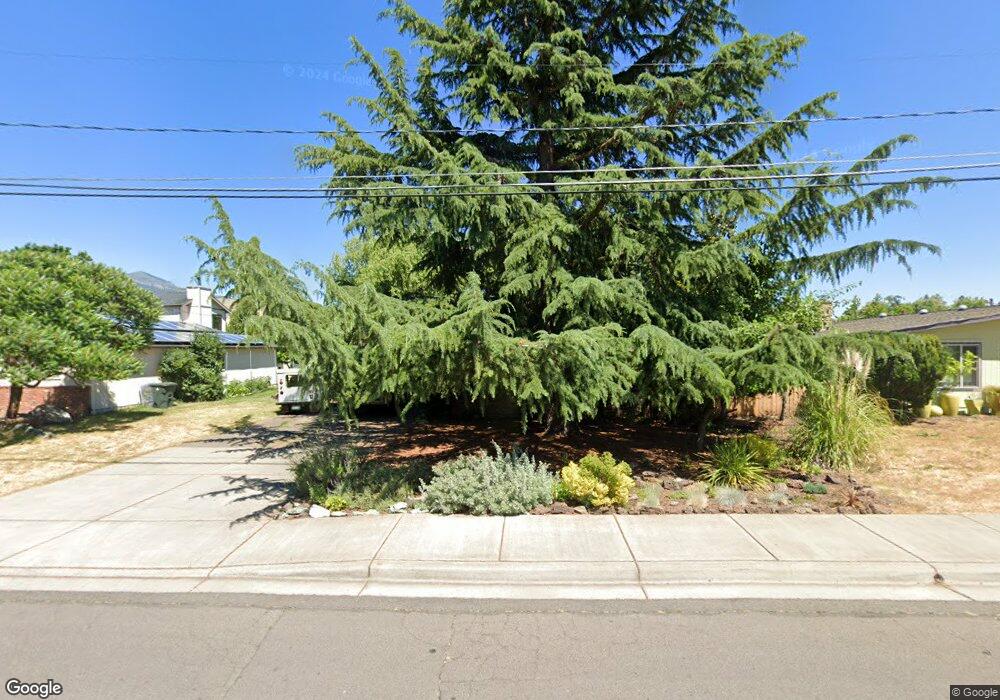
530 N Laurel St Ashland, OR 97520
Quiet Village NeighborhoodEstimated Value: $154,000 - $479,000
2
Beds
1
Bath
1,124
Sq Ft
$324/Sq Ft
Est. Value
About This Home
This home is located at 530 N Laurel St, Ashland, OR 97520 and is currently estimated at $364,667, approximately $324 per square foot. 530 N Laurel St is a home located in Jackson County with nearby schools including Helman Elementary School, Ashland Middle School, and Ashland High School.
Ownership History
Date
Name
Owned For
Owner Type
Purchase Details
Closed on
Dec 4, 2024
Sold by
Clover Living Trust and Clover Dave
Bought by
Cook Deborah A
Current Estimated Value
Purchase Details
Closed on
Sep 4, 2020
Sold by
Clover Dave and Clover Dorothy A
Bought by
Cook Deborah A
Home Financials for this Owner
Home Financials are based on the most recent Mortgage that was taken out on this home.
Original Mortgage
$150,000
Interest Rate
3%
Mortgage Type
Land Contract Argmt. Of Sale
Create a Home Valuation Report for This Property
The Home Valuation Report is an in-depth analysis detailing your home's value as well as a comparison with similar homes in the area
Home Values in the Area
Average Home Value in this Area
Purchase History
| Date | Buyer | Sale Price | Title Company |
|---|---|---|---|
| Cook Deborah A | $150,000 | None Listed On Document | |
| Cook Deborah A | $150,000 | None Available | |
| Cook Deborah A | $150,000 | None Available |
Source: Public Records
Mortgage History
| Date | Status | Borrower | Loan Amount |
|---|---|---|---|
| Previous Owner | Cook Deborah A | $150,000 | |
| Closed | Cook Deborah A | $0 |
Source: Public Records
Tax History Compared to Growth
Tax History
| Year | Tax Paid | Tax Assessment Tax Assessment Total Assessment is a certain percentage of the fair market value that is determined by local assessors to be the total taxable value of land and additions on the property. | Land | Improvement |
|---|---|---|---|---|
| 2025 | $3,058 | $197,220 | $90,190 | $107,030 |
| 2024 | $3,058 | $191,480 | $87,570 | $103,910 |
| 2023 | $2,958 | $185,910 | $85,030 | $100,880 |
| 2022 | $2,863 | $185,910 | $85,030 | $100,880 |
| 2021 | $2,766 | $180,500 | $82,560 | $97,940 |
| 2020 | $2,688 | $175,250 | $80,160 | $95,090 |
| 2019 | $2,646 | $165,200 | $75,570 | $89,630 |
| 2018 | $2,500 | $160,390 | $73,370 | $87,020 |
| 2017 | $2,481 | $160,390 | $73,370 | $87,020 |
| 2016 | $2,417 | $151,190 | $69,150 | $82,040 |
| 2015 | $2,323 | $151,190 | $69,150 | $82,040 |
| 2014 | $2,248 | $142,520 | $65,190 | $77,330 |
Source: Public Records
Map
Nearby Homes
- 166 Mountain View Dr
- 595 Elizabeth Ave
- 520 Helman St
- 330 Glenn St
- 332 Randy St
- 0 Helman St Unit 220206619
- 356 Randy St
- 384 Glenn St
- 364 Randy St
- 323 Glenn St Unit 6
- 566 Coffee Ln
- 311 Glenn St Unit 3
- 767 Oak St
- 662 Vansant St
- 451 N Main St
- 67 Woolen Way
- 224 Alicia St
- 472 Lindsay Ln
- 111 Nursery St
- 173 Helman St
- 540 N Laurel St
- 524 N Laurel St
- 155 Mountain View Dr
- 167 Mountain View Dr
- 531 N Laurel St
- 523 N Laurel St
- 539 Parkside Dr
- 537 Parkside Dr
- 537 N Laurel St
- 147 Mountain View Dr
- 509 N Laurel St
- 478 N Laurel St
- 221 Otis St
- 148 Mountain View Dr Unit Lot12
- 210 Otis St
- 524 Drager St
- 146 Mountain View Dr Unit Lot11
- 146 Mountain View Dr
- 541 Parkside Dr
- 493 N Laurel St