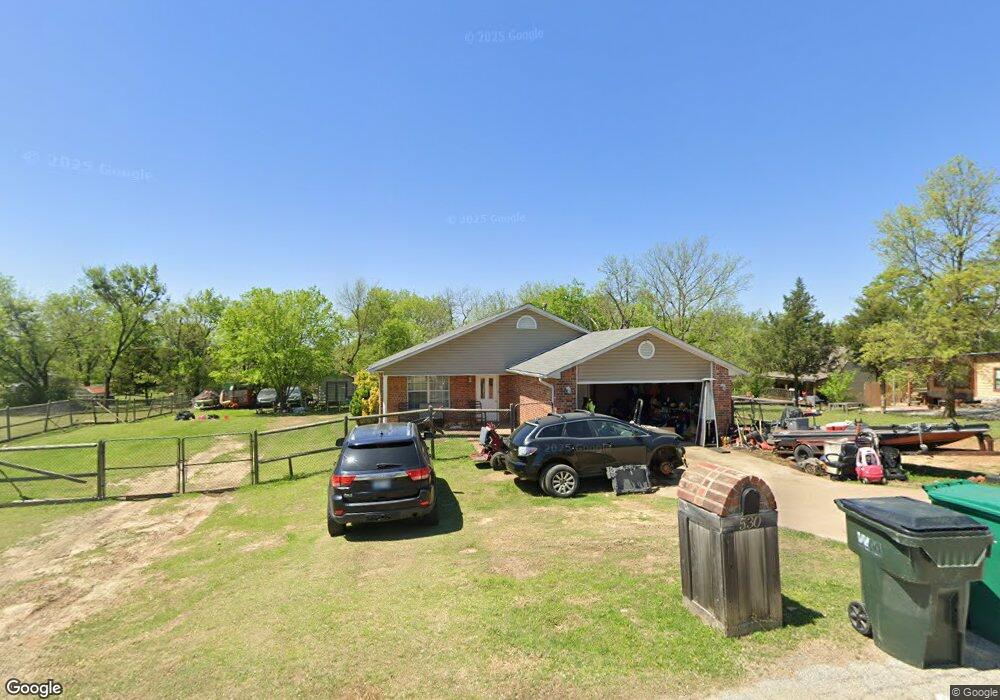
530 N Main St Sapulpa, OK 74066
Estimated Value: $178,375 - $212,000
3
Beds
2
Baths
1,292
Sq Ft
$153/Sq Ft
Est. Value
About This Home
This home is located at 530 N Main St, Sapulpa, OK 74066 and is currently estimated at $197,344, approximately $152 per square foot. 530 N Main St is a home located in Creek County with nearby schools including Sapulpa Junior High School, Sapulpa Middle School, and Sapulpa High School.
Ownership History
Date
Name
Owned For
Owner Type
Purchase Details
Closed on
Nov 2, 2015
Sold by
Zelaya Jose Francisco
Bought by
Lopez Griselda
Current Estimated Value
Purchase Details
Closed on
Sep 26, 2012
Sold by
Gilbert Violet Nadine and Parrish Shirley June
Bought by
Lopez Griselda and Taaber Viridiana
Purchase Details
Closed on
Feb 1, 2005
Sold by
Foley Thomas Shadrach and Foley Rachel Dawn
Bought by
Lopez Griselda
Home Financials for this Owner
Home Financials are based on the most recent Mortgage that was taken out on this home.
Original Mortgage
$86,800
Interest Rate
5.8%
Mortgage Type
New Conventional
Purchase Details
Closed on
Jan 13, 2005
Sold by
Rache Thomas Sand and Rache Foley D
Bought by
Foley Thomas and Foley Rachel
Home Financials for this Owner
Home Financials are based on the most recent Mortgage that was taken out on this home.
Original Mortgage
$86,800
Interest Rate
5.8%
Mortgage Type
New Conventional
Create a Home Valuation Report for This Property
The Home Valuation Report is an in-depth analysis detailing your home's value as well as a comparison with similar homes in the area
Home Values in the Area
Average Home Value in this Area
Purchase History
| Date | Buyer | Sale Price | Title Company |
|---|---|---|---|
| Lopez Griselda | -- | None Available | |
| Lopez Griselda | $30,000 | None Available | |
| Lopez Griselda | -- | None Available | |
| Foley Thomas | -- | None Available |
Source: Public Records
Mortgage History
| Date | Status | Borrower | Loan Amount |
|---|---|---|---|
| Previous Owner | Lopez Griselda | $86,800 |
Source: Public Records
Tax History Compared to Growth
Tax History
| Year | Tax Paid | Tax Assessment Tax Assessment Total Assessment is a certain percentage of the fair market value that is determined by local assessors to be the total taxable value of land and additions on the property. | Land | Improvement |
|---|---|---|---|---|
| 2025 | $2,016 | $16,930 | $1,320 | $15,610 |
| 2024 | $1,960 | $16,125 | $1,320 | $14,805 |
| 2023 | $1,960 | $15,357 | $1,320 | $14,037 |
| 2022 | $1,680 | $14,626 | $1,320 | $13,306 |
| 2021 | $1,653 | $13,929 | $1,320 | $12,609 |
| 2020 | $1,624 | $13,765 | $1,320 | $12,445 |
| 2019 | $1,569 | $13,235 | $1,320 | $11,915 |
| 2018 | $1,525 | $12,605 | $1,320 | $11,285 |
| 2017 | $1,517 | $12,605 | $1,320 | $11,285 |
| 2016 | $1,443 | $12,605 | $1,320 | $11,285 |
| 2015 | -- | $12,605 | $1,320 | $11,285 |
| 2014 | -- | $12,583 | $1,386 | $11,197 |
Source: Public Records
Map
Nearby Homes
- 115 W Anderson St
- 0 N 13th St
- 0 Line Ave Unit 2546053
- 720 N Main St
- 716 N 10th St
- 0 N Johannes St Unit 2546940
- 904 N 9th St
- 115 N Mounds St
- 208 N Burnett St
- 0 N Gray St
- 14 S Mounds St
- 0 N Mann St
- 111 S Poplar St
- 310 W Lee Ave
- 1124 N 9th St
- 210 S Water St
- 131 S Hickory St
- 206 S Mounds St
- 139 S Hickory St
- 317 S Poplar St