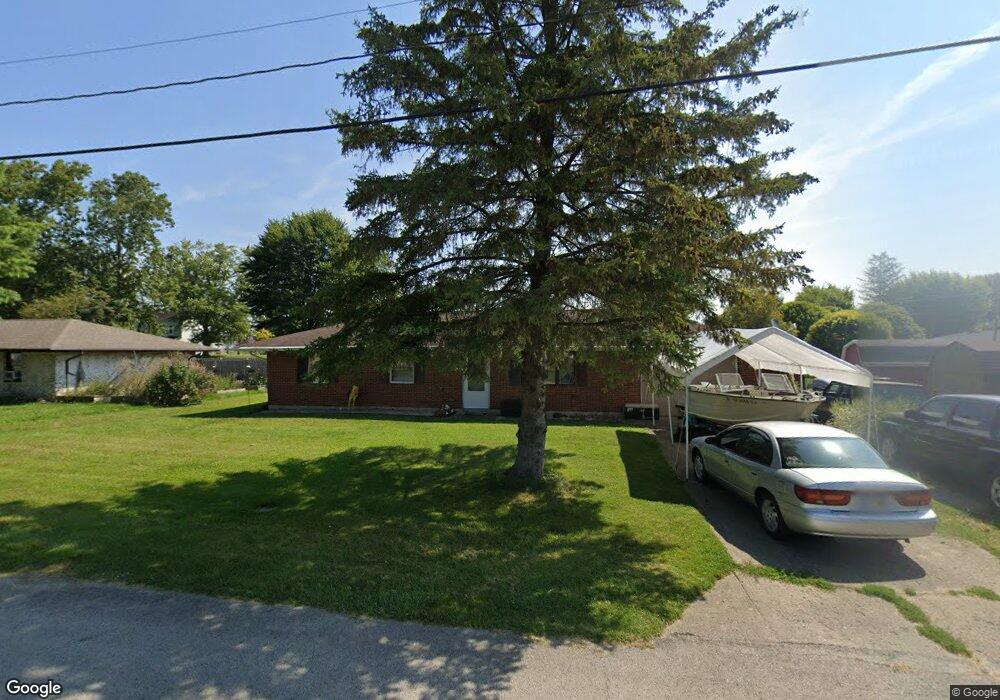
530 N Maple St Eldorado, OH 45321
Estimated Value: $119,000 - $135,000
3
Beds
2
Baths
1,050
Sq Ft
$121/Sq Ft
Est. Value
About This Home
This home is located at 530 N Maple St, Eldorado, OH 45321 and is currently estimated at $126,897, approximately $120 per square foot. 530 N Maple St is a home located in Preble County with nearby schools including National Trail Elementary School, National Trail Middle School, and National Trail High School.
Ownership History
Date
Name
Owned For
Owner Type
Purchase Details
Closed on
Nov 21, 2025
Sold by
Earles Kenneth E
Bought by
Snp Re Llc
Current Estimated Value
Home Financials for this Owner
Home Financials are based on the most recent Mortgage that was taken out on this home.
Original Mortgage
$90,400
Outstanding Balance
$90,400
Interest Rate
6.27%
Mortgage Type
Credit Line Revolving
Estimated Equity
$36,497
Purchase Details
Closed on
Jun 9, 2020
Sold by
Hanes Keith David
Bought by
Earles Kenneth E
Home Financials for this Owner
Home Financials are based on the most recent Mortgage that was taken out on this home.
Original Mortgage
$79,026
Interest Rate
3.2%
Mortgage Type
VA
Purchase Details
Closed on
Apr 22, 2014
Sold by
Simley Corp
Bought by
Hanes Keith David
Purchase Details
Closed on
Sep 22, 2006
Sold by
Finn Linda F and Finn Marvin E
Bought by
Simley Corp
Purchase Details
Closed on
Dec 20, 2005
Sold by
Finn Marvin E and Finn Linda F
Bought by
Finn Linda F
Purchase Details
Closed on
Oct 6, 1999
Sold by
Smith Kendrick
Bought by
Finn Marvin E and Finn Linda F
Create a Home Valuation Report for This Property
The Home Valuation Report is an in-depth analysis detailing your home's value as well as a comparison with similar homes in the area
Purchase History
| Date | Buyer | Sale Price | Title Company |
|---|---|---|---|
| Snp Re Llc | -- | Freedom Title Company | |
| Earles Kenneth E | $77,300 | Freedom Title Company Inc | |
| Hanes Keith David | $60,000 | Freedom Title Co | |
| Simley Corp | $56,000 | Southwestern Ohio Title Agen | |
| Finn Linda F | -- | None Available | |
| Finn Marvin E | $57,000 | -- |
Source: Public Records
Mortgage History
| Date | Status | Borrower | Loan Amount |
|---|---|---|---|
| Open | Snp Re Llc | $90,400 | |
| Previous Owner | Earles Kenneth E | $79,026 |
Source: Public Records
Tax History
| Year | Tax Paid | Tax Assessment Tax Assessment Total Assessment is a certain percentage of the fair market value that is determined by local assessors to be the total taxable value of land and additions on the property. | Land | Improvement |
|---|---|---|---|---|
| 2025 | $1,249 | $32,100 | $5,430 | $26,670 |
| 2024 | $1,249 | $32,100 | $5,430 | $26,670 |
| 2023 | $1,240 | $32,100 | $5,430 | $26,670 |
| 2022 | $1,219 | $27,100 | $3,820 | $23,280 |
| 2021 | $1,282 | $27,100 | $3,820 | $23,280 |
| 2020 | $1,186 | $27,100 | $3,820 | $23,280 |
| 2019 | $1,166 | $26,890 | $3,820 | $23,070 |
| 2018 | $1,137 | $26,890 | $3,820 | $23,070 |
| 2017 | $1,187 | $26,890 | $3,820 | $23,070 |
| 2016 | $1,039 | $26,570 | $3,820 | $22,750 |
| 2014 | $977 | $26,570 | $3,820 | $22,750 |
| 2013 | $539 | $26,565 | $3,815 | $22,750 |
Source: Public Records
Map
Nearby Homes
- 410 N Main St
- 0 OTTERBEIN-ITHACA Preble Co Butler Township
- 1213 W Holtzmuller Rd
- 119 W Orchard St
- 408 N Main St
- 210 High St
- 217 Orchard St
- 246 N Main St
- 0 Lewisburg Western Rd
- Lot 6 Ridgeview Dr
- Lot 3 Ridgeview Dr
- Lot 7 Ridgeview Dr
- Lot 13 Ridgeview Dr
- 335 State Route 121 N
- 126 Cherry St
- Lot 14 & Lot 15 Ridgeview Dr
- Lot 5 & Lot 9 Ridgeview Dr
- 123 N Harrison St
- 113 E Washington St
- 204 Fairview Ave
Your Personal Tour Guide
Ask me questions while you tour the home.