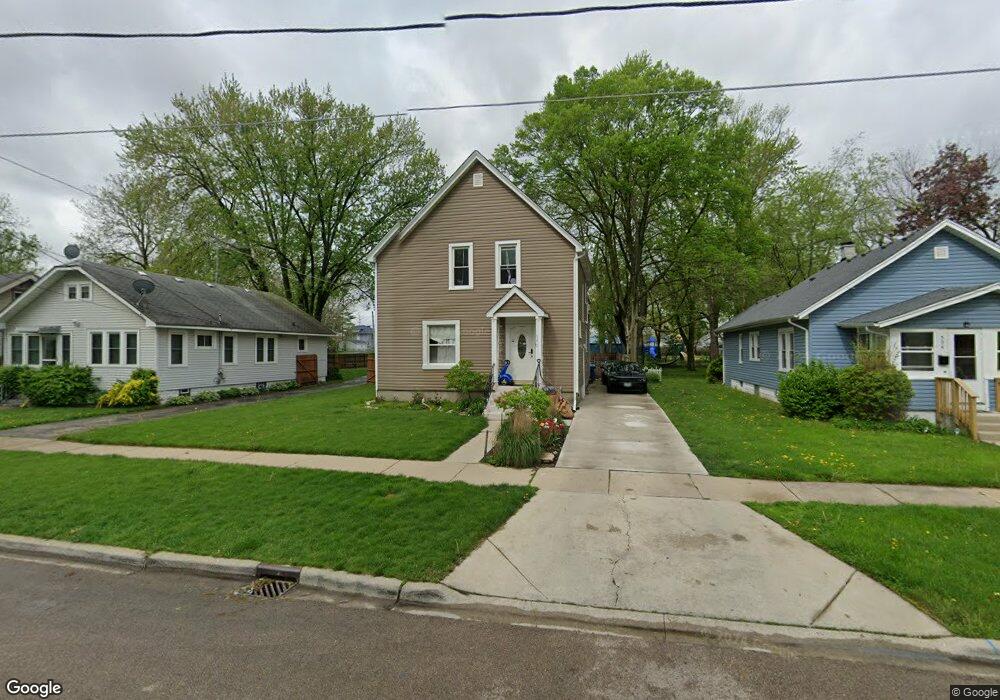
530 N May St Aurora, IL 60506
Near West Galena NeighborhoodEstimated Value: $228,000 - $255,000
3
Beds
2
Baths
1,572
Sq Ft
$155/Sq Ft
Est. Value
About This Home
This home is located at 530 N May St, Aurora, IL 60506 and is currently estimated at $242,994, approximately $154 per square foot. 530 N May St is a home located in Kane County with nearby schools including Greenman Elementary School, Washington Middle School, and West Aurora High School.
Ownership History
Date
Name
Owned For
Owner Type
Purchase Details
Closed on
Jun 2, 2022
Sold by
Cristina Cano
Bought by
Cano Cristina and Rojas Jose Luis
Current Estimated Value
Purchase Details
Closed on
May 5, 2020
Sold by
Jesus Ceballos Gerardo De and Cano Cristina
Bought by
Cano Cristina
Purchase Details
Closed on
Jun 26, 2018
Sold by
Cano Cristina
Bought by
Ceballos Gerardo De Jesus and Cano Cristina
Purchase Details
Closed on
Jun 24, 2014
Sold by
Zamarripa Maria and Vazquez Maria
Bought by
Cano Cristina
Home Financials for this Owner
Home Financials are based on the most recent Mortgage that was taken out on this home.
Original Mortgage
$72,446
Interest Rate
3.75%
Mortgage Type
FHA
Purchase Details
Closed on
Jul 25, 2012
Sold by
Contreras Azucena
Bought by
Vazquez Maria
Purchase Details
Closed on
Mar 14, 2009
Sold by
Contreras Juan Hernandez
Bought by
Contreras Azucena
Purchase Details
Closed on
May 18, 2007
Sold by
Contreras Juan Hernandez
Bought by
Contreras Juan Hernandez and Contreras Azucena
Home Financials for this Owner
Home Financials are based on the most recent Mortgage that was taken out on this home.
Original Mortgage
$155,500
Interest Rate
6.8%
Mortgage Type
Unknown
Purchase Details
Closed on
May 26, 2005
Sold by
Dominguez Ervey
Bought by
Contreras Juan Hernandez
Home Financials for this Owner
Home Financials are based on the most recent Mortgage that was taken out on this home.
Original Mortgage
$119,920
Interest Rate
7.65%
Mortgage Type
Purchase Money Mortgage
Purchase Details
Closed on
Sep 27, 2004
Sold by
Fannie Mae
Bought by
Dominguez Ervey
Home Financials for this Owner
Home Financials are based on the most recent Mortgage that was taken out on this home.
Original Mortgage
$91,200
Interest Rate
8.55%
Mortgage Type
Purchase Money Mortgage
Purchase Details
Closed on
Jun 30, 2004
Sold by
Sosa Gerardo and Sosa Alecia D
Bought by
Federal National Mortgage Association
Purchase Details
Closed on
Nov 26, 2003
Sold by
Sosa Geraldo
Bought by
Sosa Alecia
Purchase Details
Closed on
Oct 24, 1997
Sold by
Williams Nathaniel T and Williams Genneive R
Bought by
Sosa Gerardo
Home Financials for this Owner
Home Financials are based on the most recent Mortgage that was taken out on this home.
Original Mortgage
$55,900
Interest Rate
7.65%
Mortgage Type
FHA
Create a Home Valuation Report for This Property
The Home Valuation Report is an in-depth analysis detailing your home's value as well as a comparison with similar homes in the area
Home Values in the Area
Average Home Value in this Area
Purchase History
| Date | Buyer | Sale Price | Title Company |
|---|---|---|---|
| Cano Cristina | -- | Chicago Title | |
| Cano Cristina | $10,000 | Chicago Title Insurance Co | |
| Ceballos Gerardo De Jesus | -- | Attorney | |
| Cano Cristina | $75,000 | Multiple | |
| Vazquez Maria | $50,000 | Fidelity Title Agency | |
| Contreras Azucena | -- | None Available | |
| Contreras Juan Hernandez | -- | Citywide Title Corporation | |
| Contreras Juan Hernandez | $150,000 | First American Title | |
| Dominguez Ervey | -- | Greater Illinois Title Compa | |
| Federal National Mortgage Association | -- | -- | |
| Sosa Alecia | -- | -- | |
| Sosa Gerardo | $37,333 | -- |
Source: Public Records
Mortgage History
| Date | Status | Borrower | Loan Amount |
|---|---|---|---|
| Open | Cano Cristina | $137,362 | |
| Previous Owner | Cano Cristina | $72,446 | |
| Previous Owner | Cano Cristina | $7,500 | |
| Previous Owner | Contreras Juan Hernandez | $155,500 | |
| Previous Owner | Contreras Juan Hernandez | $119,920 | |
| Previous Owner | Contreras Juan Hernandez | $29,980 | |
| Previous Owner | Dominguez Ervey | $91,200 | |
| Previous Owner | Sosa Gerardo | $87,000 | |
| Previous Owner | Sosa Gerardo | $55,900 | |
| Closed | Dominguez Ervey | $22,800 |
Source: Public Records
Tax History Compared to Growth
Tax History
| Year | Tax Paid | Tax Assessment Tax Assessment Total Assessment is a certain percentage of the fair market value that is determined by local assessors to be the total taxable value of land and additions on the property. | Land | Improvement |
|---|---|---|---|---|
| 2024 | $4,067 | $59,361 | $7,955 | $51,406 |
| 2023 | $3,433 | $48,082 | $7,108 | $40,974 |
| 2022 | $3,206 | $42,216 | $6,485 | $35,731 |
| 2021 | $3,121 | $40,159 | $6,038 | $34,121 |
| 2020 | $2,930 | $37,301 | $5,608 | $31,693 |
| 2019 | $2,793 | $34,560 | $5,196 | $29,364 |
| 2018 | $2,319 | $29,231 | $4,806 | $24,425 |
| 2017 | $1,981 | $25,251 | $4,428 | $20,823 |
| 2016 | $1,683 | $21,845 | $3,796 | $18,049 |
| 2015 | -- | $18,464 | $3,264 | $15,200 |
| 2014 | -- | $16,946 | $3,140 | $13,806 |
| 2013 | -- | $22,309 | $3,095 | $19,214 |
Source: Public Records
Map
Nearby Homes
- 526 N View St
- 602 N May St
- 519 N View St
- 441 N View St
- 518 W Park Ave
- 415 Blackhawk St
- 541 Charles St
- 932 W New York St
- 809 W Park Ave
- 222 Grand Ave
- 616 Morton Ave
- 644 Oak Ave
- 450 W Downer Place Unit 4C
- 810 W Galena Blvd
- 943 Charles St
- 710 W Downer Place
- 256 W Downer Place
- 850 W Galena Blvd
- 1015 Charles St
- 930 W New York St Unit 932