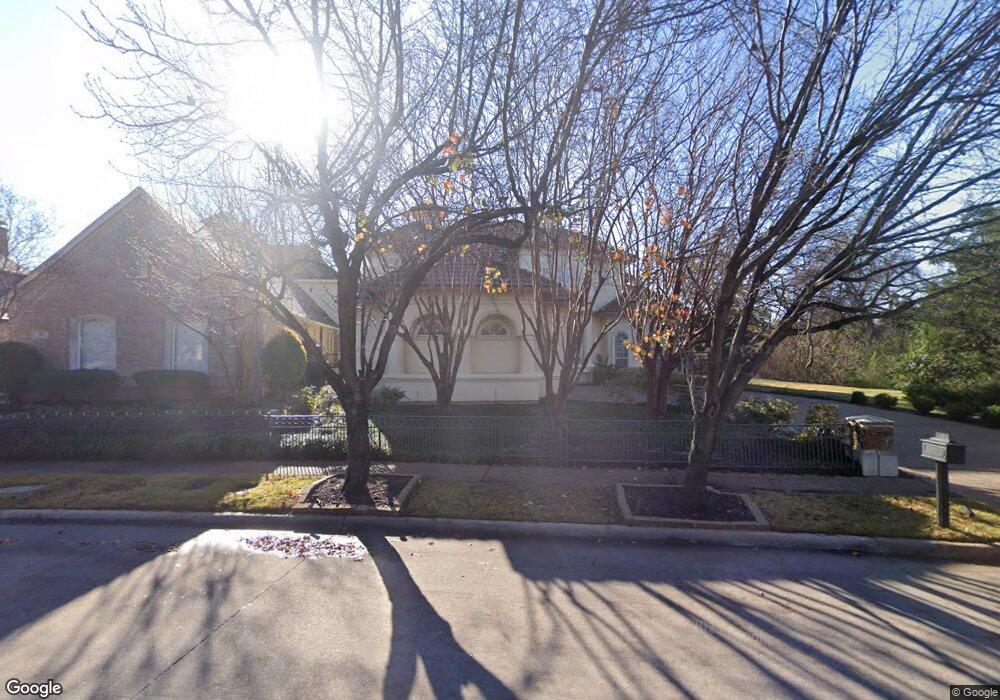
530 Regency Crossing Southlake, TX 76092
Estimated Value: $1,054,000 - $1,384,000
4
Beds
4
Baths
3,480
Sq Ft
$354/Sq Ft
Est. Value
About This Home
This home is located at 530 Regency Crossing, Southlake, TX 76092 and is currently estimated at $1,232,079, approximately $354 per square foot. 530 Regency Crossing is a home located in Tarrant County with nearby schools including Old Union Elementary School, Eubanks Intermediate School, and George Dawson Middle School.
Ownership History
Date
Name
Owned For
Owner Type
Purchase Details
Closed on
Dec 1, 2008
Sold by
Haskins Monica
Bought by
Weingartner Robert
Current Estimated Value
Home Financials for this Owner
Home Financials are based on the most recent Mortgage that was taken out on this home.
Original Mortgage
$540,000
Outstanding Balance
$354,354
Interest Rate
5.99%
Mortgage Type
Seller Take Back
Estimated Equity
$877,725
Purchase Details
Closed on
May 14, 2007
Sold by
Benoist Glenn H and Benoist Tanya
Bought by
Haskins Monica
Purchase Details
Closed on
Sep 5, 2003
Sold by
Wells Fargo Bank Minnesota Na
Bought by
Benoist Glenn H and Benoist Tanya
Home Financials for this Owner
Home Financials are based on the most recent Mortgage that was taken out on this home.
Original Mortgage
$392,000
Interest Rate
6.31%
Mortgage Type
Purchase Money Mortgage
Purchase Details
Closed on
May 6, 2003
Sold by
Burke Bryan R and Burke Enice L
Bought by
Wells Fargo Bank Minnesota Na and Norwest Bank Minnesota Na
Create a Home Valuation Report for This Property
The Home Valuation Report is an in-depth analysis detailing your home's value as well as a comparison with similar homes in the area
Home Values in the Area
Average Home Value in this Area
Purchase History
| Date | Buyer | Sale Price | Title Company |
|---|---|---|---|
| Weingartner Robert | -- | Natc | |
| Haskins Monica | -- | Hexter Fair Title Company | |
| Benoist Glenn H | -- | First American Title | |
| Wells Fargo Bank Minnesota Na | $426,530 | -- |
Source: Public Records
Mortgage History
| Date | Status | Borrower | Loan Amount |
|---|---|---|---|
| Open | Weingartner Robert | $540,000 | |
| Previous Owner | Benoist Glenn H | $392,000 | |
| Closed | Benoist Glenn H | $73,500 |
Source: Public Records
Tax History Compared to Growth
Tax History
| Year | Tax Paid | Tax Assessment Tax Assessment Total Assessment is a certain percentage of the fair market value that is determined by local assessors to be the total taxable value of land and additions on the property. | Land | Improvement |
|---|---|---|---|---|
| 2025 | $11,340 | $820,994 | $250,000 | $570,994 |
| 2024 | $11,340 | $1,000,000 | $250,000 | $750,000 |
| 2023 | $14,877 | $1,101,066 | $250,000 | $851,066 |
| 2022 | $16,008 | $742,000 | $175,000 | $567,000 |
| 2021 | $16,918 | $742,000 | $175,000 | $567,000 |
| 2020 | $17,692 | $769,685 | $175,000 | $594,685 |
| 2019 | $18,638 | $769,684 | $175,000 | $594,684 |
| 2018 | $16,330 | $715,000 | $210,000 | $505,000 |
| 2017 | $16,111 | $650,000 | $189,579 | $460,421 |
| 2016 | $16,590 | $669,332 | $210,000 | $459,332 |
| 2015 | $15,499 | $734,831 | $150,000 | $584,831 |
| 2014 | $15,499 | $639,300 | $75,000 | $564,300 |
Source: Public Records
Map
Nearby Homes
- 521 Regency Crossing
- 1420 Kensington Ct
- 608 Regency Crossing
- 7322 Calloway Ct
- 7316 Calloway Ct
- 1417 Nottoway Ct
- 1418 Nottoway Ct
- 1406 Nottoway Ct
- 7208 Stilton Ct
- 7106 Belle Meade Dr
- 7200 Belle Meade Dr
- 1227 Strathmore Dr
- 1719 Byron Nelson Pkwy
- 7001 Colleyville Blvd
- 7255 Oak Alley Dr
- 7312 Hix Ct
- 7012 Shepherds Glen
- TBD - Lot 3 John Mccain Rd
- TBD - Lot 1 John Mccain Rd
- 710 Longford Dr
- 528 Regency Crossing
- 526 Queensbury Turn
- 523 Regency Crossing
- 522 Queensbury Turn
- 519 Regency Crossing
- 520 Queensbury Turn
- 517 Regency Crossing
- 518 Queensbury Turn
- 515 Regency Crossing
- 516 Queensbury Turn
- 513 Regency Crossing
- 514 Queensbury Turn
- 511 Regency Crossing
- 1433 Kensington Ct
- 512 Queensbury Turn
- 1431 Kensington Ct
- 1429 Kensington Ct
- 509 Regency Crossing
- 1427 Kensington Ct
- 1425 Kensington Ct