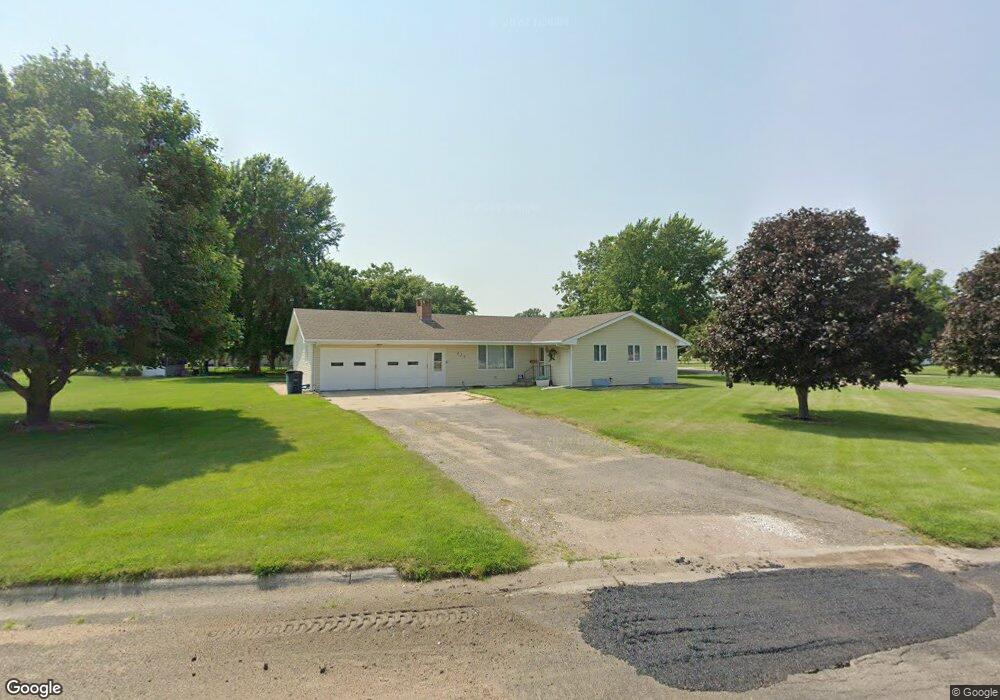
530 Rusk St Orchard, NE 68764
Estimated Value: $125,000 - $227,000
3
Beds
2
Baths
1,546
Sq Ft
$112/Sq Ft
Est. Value
About This Home
This home is located at 530 Rusk St, Orchard, NE 68764 and is currently estimated at $173,276, approximately $112 per square foot. 530 Rusk St is a home located in Antelope County.
Ownership History
Date
Name
Owned For
Owner Type
Purchase Details
Closed on
Aug 6, 2020
Sold by
Erb Kyle J and Cleveland-Erb Samantha
Bought by
Lerb Kyle J and Cleveland-Erb Samantha
Current Estimated Value
Home Financials for this Owner
Home Financials are based on the most recent Mortgage that was taken out on this home.
Original Mortgage
$132,300
Interest Rate
2.8%
Mortgage Type
New Conventional
Purchase Details
Closed on
Mar 28, 2018
Sold by
Sylvia Cleveland
Bought by
Erb Kyle J
Home Financials for this Owner
Home Financials are based on the most recent Mortgage that was taken out on this home.
Original Mortgage
$131,313
Interest Rate
4.38%
Mortgage Type
New Conventional
Purchase Details
Closed on
Aug 30, 2012
Bought by
Cleveland Sylvia
Create a Home Valuation Report for This Property
The Home Valuation Report is an in-depth analysis detailing your home's value as well as a comparison with similar homes in the area
Home Values in the Area
Average Home Value in this Area
Purchase History
| Date | Buyer | Sale Price | Title Company |
|---|---|---|---|
| Lerb Kyle J | -- | New Title Company Name | |
| Erb Kyle J | $130,000 | Schacht Abs & Title Co | |
| Cleveland Sylvia | -- | -- |
Source: Public Records
Mortgage History
| Date | Status | Borrower | Loan Amount |
|---|---|---|---|
| Previous Owner | Lerb Kyle J | $132,300 | |
| Previous Owner | Erb Kyle J | $131,313 |
Source: Public Records
Tax History Compared to Growth
Tax History
| Year | Tax Paid | Tax Assessment Tax Assessment Total Assessment is a certain percentage of the fair market value that is determined by local assessors to be the total taxable value of land and additions on the property. | Land | Improvement |
|---|---|---|---|---|
| 2024 | $1,268 | $97,090 | $3,355 | $93,735 |
| 2023 | $1,549 | $97,090 | $3,355 | $93,735 |
| 2022 | $1,575 | $97,090 | $3,355 | $93,735 |
| 2021 | $1,345 | $84,475 | $3,355 | $81,120 |
| 2020 | $1,373 | $84,475 | $3,355 | $81,120 |
| 2019 | $1,290 | $84,475 | $3,355 | $81,120 |
| 2018 | $1,252 | $83,315 | $2,550 | $80,765 |
| 2017 | $0 | $72,335 | $2,550 | $69,785 |
| 2016 | $1,104 | $72,335 | $2,550 | $69,785 |
| 2015 | $1,104 | $72,335 | $2,550 | $69,785 |
| 2014 | $1,047 | $69,020 | $2,550 | $66,470 |
Source: Public Records
Map
Nearby Homes