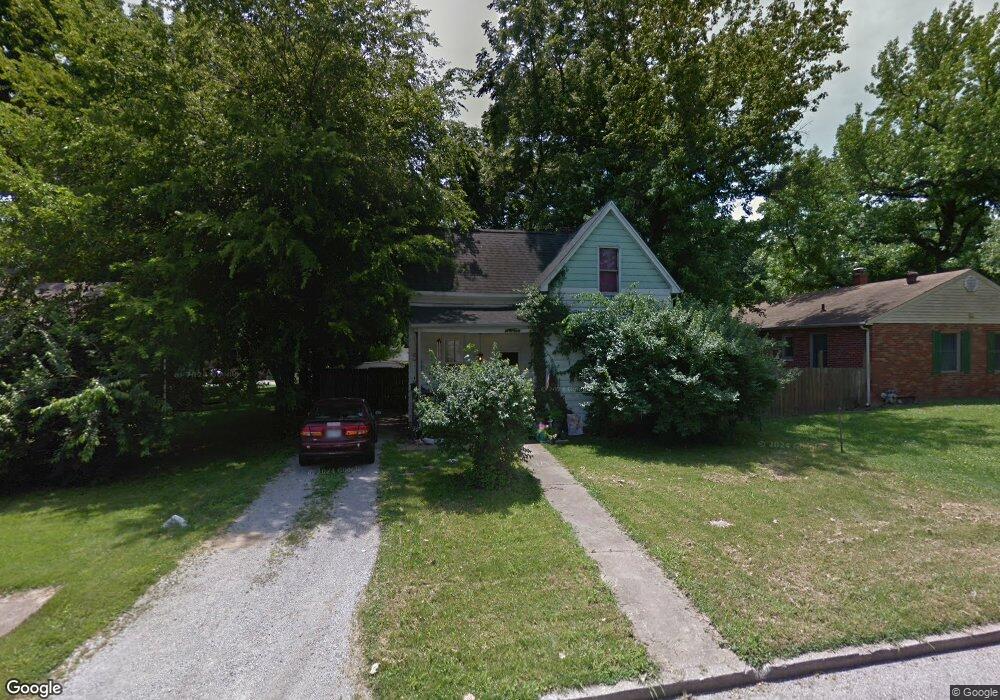
530 S 21st St Belleville, IL 62226
Estimated Value: $34,000 - $86,000
3
Beds
1
Bath
616
Sq Ft
$78/Sq Ft
Est. Value
About This Home
This home is located at 530 S 21st St, Belleville, IL 62226 and is currently estimated at $47,936, approximately $77 per square foot. 530 S 21st St is a home located in St. Clair County with nearby schools including Union Elementary School, West Jr High School, and Governor French Academy.
Ownership History
Date
Name
Owned For
Owner Type
Purchase Details
Closed on
Oct 9, 2025
Sold by
Torres Corp
Bought by
Torres Rafael
Current Estimated Value
Purchase Details
Closed on
Jun 28, 2025
Sold by
Sulkin Edward P
Bought by
Torres Corp
Purchase Details
Closed on
Feb 1, 2018
Sold by
Schroder John G
Bought by
Sulkin Edward P
Purchase Details
Closed on
Feb 27, 2004
Sold by
Jones Alva C and Jones Sandra K
Bought by
Schroder John G
Purchase Details
Closed on
Oct 10, 2003
Sold by
Jones Terry D
Bought by
Jones Alva C and Jones Sandra K
Purchase Details
Closed on
Jan 19, 2001
Sold by
Jones Alva C and Jones Sandra K
Bought by
Jones Alva C and Jones Sandra K
Create a Home Valuation Report for This Property
The Home Valuation Report is an in-depth analysis detailing your home's value as well as a comparison with similar homes in the area
Home Values in the Area
Average Home Value in this Area
Purchase History
| Date | Buyer | Sale Price | Title Company |
|---|---|---|---|
| Torres Rafael | -- | Community Title | |
| Torres Corp | -- | Community Title & Escrow | |
| Sulkin Edward P | $50,000 | Attorney | |
| Schroder John G | $50,000 | Pti | |
| Jones Alva C | -- | -- | |
| Jones Alva C | -- | -- |
Source: Public Records
Tax History Compared to Growth
Tax History
| Year | Tax Paid | Tax Assessment Tax Assessment Total Assessment is a certain percentage of the fair market value that is determined by local assessors to be the total taxable value of land and additions on the property. | Land | Improvement |
|---|---|---|---|---|
| 2024 | $2,541 | $28,894 | $3,888 | $25,006 |
| 2023 | $2,076 | $22,115 | $3,811 | $18,304 |
| 2022 | $1,906 | $19,909 | $3,431 | $16,478 |
| 2021 | $1,835 | $18,405 | $3,172 | $15,233 |
| 2020 | $1,784 | $17,405 | $3,000 | $14,405 |
| 2019 | $1,798 | $17,354 | $3,005 | $14,349 |
| 2018 | $1,758 | $16,979 | $2,940 | $14,039 |
| 2017 | $1,766 | $16,860 | $2,919 | $13,941 |
| 2016 | $1,722 | $16,502 | $2,857 | $13,645 |
| 2014 | $988 | $21,374 | $2,939 | $18,435 |
| 2013 | $1,956 | $21,680 | $2,981 | $18,699 |
Source: Public Records
Map
Nearby Homes