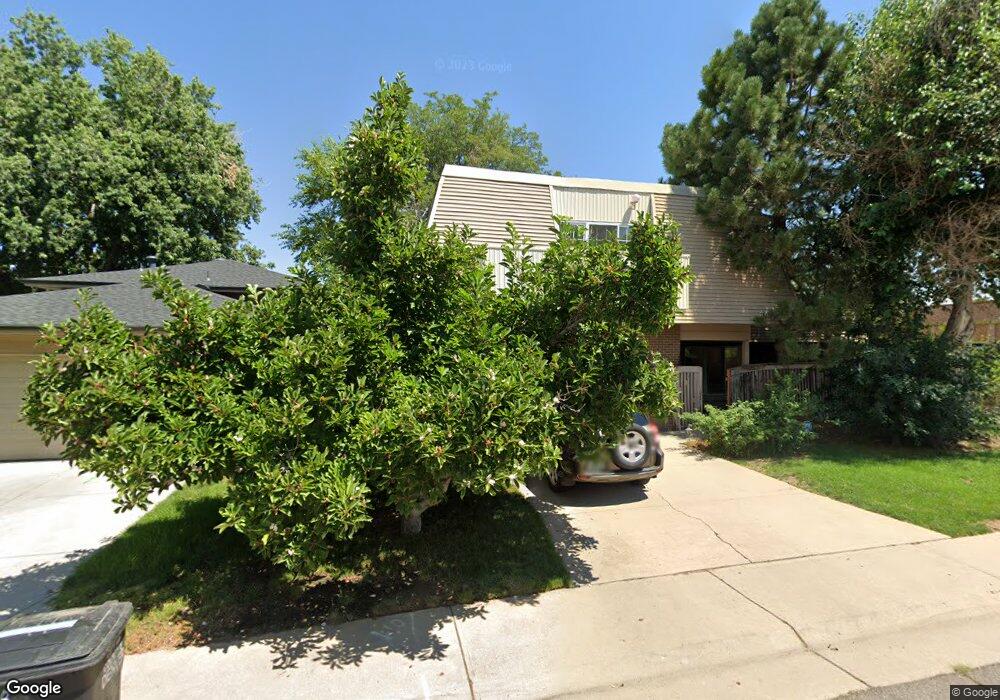
530 S Magnolia Ln Denver, CO 80224
Washington Virginia Vale NeighborhoodEstimated Value: $964,234 - $1,109,000
5
Beds
4
Baths
4,161
Sq Ft
$248/Sq Ft
Est. Value
About This Home
This home is located at 530 S Magnolia Ln, Denver, CO 80224 and is currently estimated at $1,033,809, approximately $248 per square foot. 530 S Magnolia Ln is a home located in Denver County with nearby schools including Denver Green School, George Washington High School, and Denver Academy of Torah.
Ownership History
Date
Name
Owned For
Owner Type
Purchase Details
Closed on
Apr 2, 2015
Sold by
Anderson David S and Battey King Sarah
Bought by
Sacks Elias and Sacks Elizabeth
Current Estimated Value
Home Financials for this Owner
Home Financials are based on the most recent Mortgage that was taken out on this home.
Original Mortgage
$479,920
Outstanding Balance
$371,322
Interest Rate
3.88%
Mortgage Type
New Conventional
Estimated Equity
$662,487
Purchase Details
Closed on
Feb 24, 2000
Sold by
Laven Fellman Gary L
Bought by
Anderson David S and Battey King Sarah
Home Financials for this Owner
Home Financials are based on the most recent Mortgage that was taken out on this home.
Original Mortgage
$223,920
Interest Rate
8.19%
Purchase Details
Closed on
Dec 6, 1993
Sold by
Gerash Helen S
Bought by
Fellman Gary L and Vanlaven Fellman Jodi Lee
Home Financials for this Owner
Home Financials are based on the most recent Mortgage that was taken out on this home.
Original Mortgage
$160,000
Interest Rate
7.16%
Create a Home Valuation Report for This Property
The Home Valuation Report is an in-depth analysis detailing your home's value as well as a comparison with similar homes in the area
Home Values in the Area
Average Home Value in this Area
Purchase History
| Date | Buyer | Sale Price | Title Company |
|---|---|---|---|
| Sacks Elias | $599,900 | Fidelity National Title | |
| Anderson David S | $279,900 | -- | |
| Fellman Gary L | $210,000 | Land Title Guarantee Company |
Source: Public Records
Mortgage History
| Date | Status | Borrower | Loan Amount |
|---|---|---|---|
| Open | Sacks Elias | $479,920 | |
| Previous Owner | Anderson David S | $223,920 | |
| Previous Owner | Fellman Gary L | $160,000 | |
| Closed | Anderson David S | $55,980 |
Source: Public Records
Tax History Compared to Growth
Tax History
| Year | Tax Paid | Tax Assessment Tax Assessment Total Assessment is a certain percentage of the fair market value that is determined by local assessors to be the total taxable value of land and additions on the property. | Land | Improvement |
|---|---|---|---|---|
| 2024 | $4,280 | $54,040 | $17,340 | $36,700 |
| 2023 | $4,187 | $54,040 | $17,340 | $36,700 |
| 2022 | $3,924 | $49,340 | $17,450 | $31,890 |
| 2021 | $3,788 | $50,760 | $17,950 | $32,810 |
| 2020 | $3,751 | $50,550 | $11,220 | $39,330 |
| 2019 | $3,645 | $50,550 | $11,220 | $39,330 |
| 2018 | $3,764 | $48,650 | $11,300 | $37,350 |
| 2017 | $3,753 | $48,650 | $11,300 | $37,350 |
| 2016 | $3,403 | $41,730 | $8,995 | $32,735 |
| 2015 | $2,784 | $35,630 | $8,995 | $26,635 |
| 2014 | $2,746 | $33,060 | $7,705 | $25,355 |
Source: Public Records
Map
Nearby Homes
- 434 S Newport Way
- 6524 E Alaska Dr
- 441 S Monaco Pkwy
- 6685 E Exposition Ave
- 6601 E Exposition Ave
- 404 S Oneida Way
- 435 S Olive Way
- 507 S Pontiac Way
- 7055 E Virginia Ave
- 703 S Oneida Way
- 488 S Leyden St
- 308 S Locust St
- 7155 E Exposition Ave
- 405 S Krameria St
- 360 S Krameria St
- 778 S Leyden St
- 786 S Leyden St
- 222 S Olive St
- 715 S Krameria St Unit 715/725
- 765 S Krameria St
- 528 S Magnolia Ln
- 6690 E Virginia Ave
- 6680 E Virginia Ave
- 526 S Magnolia Ln
- 531 S Magnolia Ln
- 529 S Magnolia Ln
- 6670 E Virginia Ave
- 524 S Magnolia Ln
- 527 S Magnolia Ln
- 6660 E Virginia Ave
- 522 S Magnolia Ln
- 525 S Magnolia Ln
- 6650 E Virginia Ave
- 483 S Niagara St
- 484 S Niagara St
- 523 S Magnolia Ln
- 482 S Magnolia St
- 6640 E Virginia Ave
- 521 S Magnolia Ln
- 463 S Niagara St