Estimated Value: $103,849 - $140,000
4
Beds
2
Baths
1,752
Sq Ft
$66/Sq Ft
Est. Value
About This Home
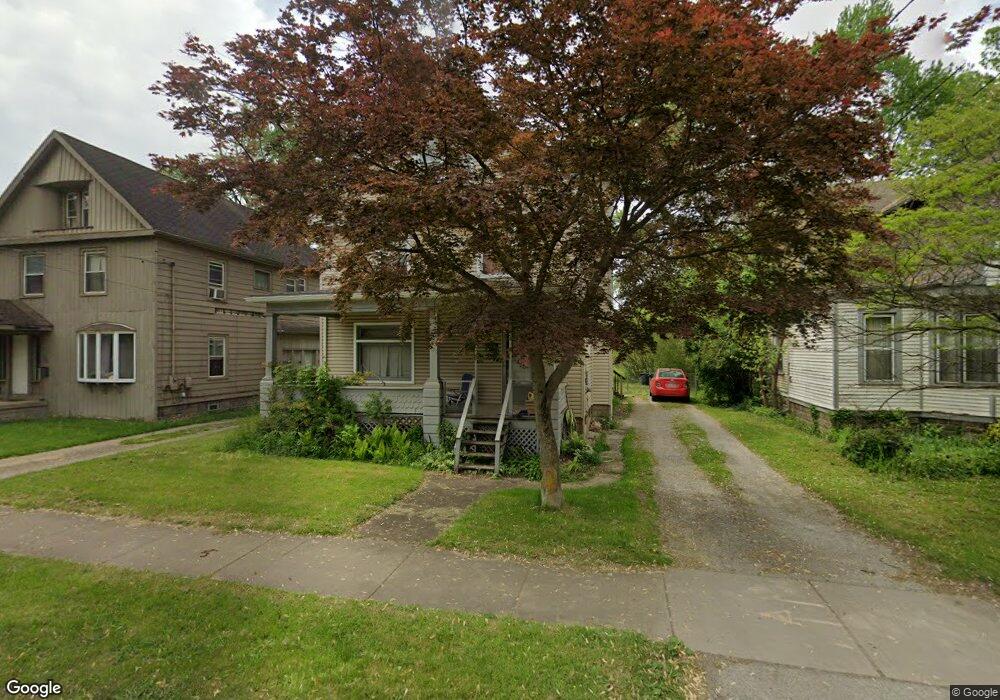
This home is located at 530 S Main St, Niles, OH 44446 and is currently estimated at $116,212, approximately $66 per square foot. 530 S Main St is a home located in Trumbull County with nearby schools including Niles Primary School, Niles Intermediate School, and Niles Middle School.
Ownership History
Date
Name
Owned For
Owner Type
Purchase Details
Closed on
Sep 26, 1996
Sold by
Jacobs Sylvia H
Bought by
Baker David R
Current Estimated Value
Home Financials for this Owner
Home Financials are based on the most recent Mortgage that was taken out on this home.
Original Mortgage
$45,590
Outstanding Balance
$4,141
Interest Rate
7.97%
Mortgage Type
New Conventional
Estimated Equity
$112,071
Purchase Details
Closed on
Jan 1, 1990
Bought by
Gladys E Heath
Create a Home Valuation Report for This Property
The Home Valuation Report is an in-depth analysis detailing your home's value as well as a comparison with similar homes in the area
Home Values in the Area
Average Home Value in this Area
Purchase History
| Date | Buyer | Sale Price | Title Company |
|---|---|---|---|
| Baker David R | $47,000 | -- | |
| Gladys E Heath | -- | -- |
Source: Public Records
Mortgage History
| Date | Status | Borrower | Loan Amount |
|---|---|---|---|
| Open | Baker David R | $45,590 |
Source: Public Records
Tax History
| Year | Tax Paid | Tax Assessment Tax Assessment Total Assessment is a certain percentage of the fair market value that is determined by local assessors to be the total taxable value of land and additions on the property. | Land | Improvement |
|---|---|---|---|---|
| 2024 | $1,050 | $24,260 | $2,280 | $21,980 |
| 2023 | $1,040 | $24,260 | $2,280 | $21,980 |
| 2022 | $535 | $10,650 | $2,280 | $8,370 |
| 2021 | $561 | $10,650 | $2,280 | $8,370 |
| 2020 | $567 | $10,650 | $2,280 | $8,370 |
| 2019 | $552 | $9,880 | $2,280 | $7,600 |
| 2018 | $551 | $9,880 | $2,280 | $7,600 |
| 2017 | $547 | $9,880 | $2,280 | $7,600 |
| 2016 | $699 | $12,500 | $2,280 | $10,220 |
| 2015 | $692 | $12,500 | $2,280 | $10,220 |
| 2014 | $694 | $12,500 | $2,280 | $10,220 |
| 2013 | $732 | $13,900 | $2,280 | $11,620 |
Source: Public Records
Map
Nearby Homes
Your Personal Tour Guide
Ask me questions while you tour the home.