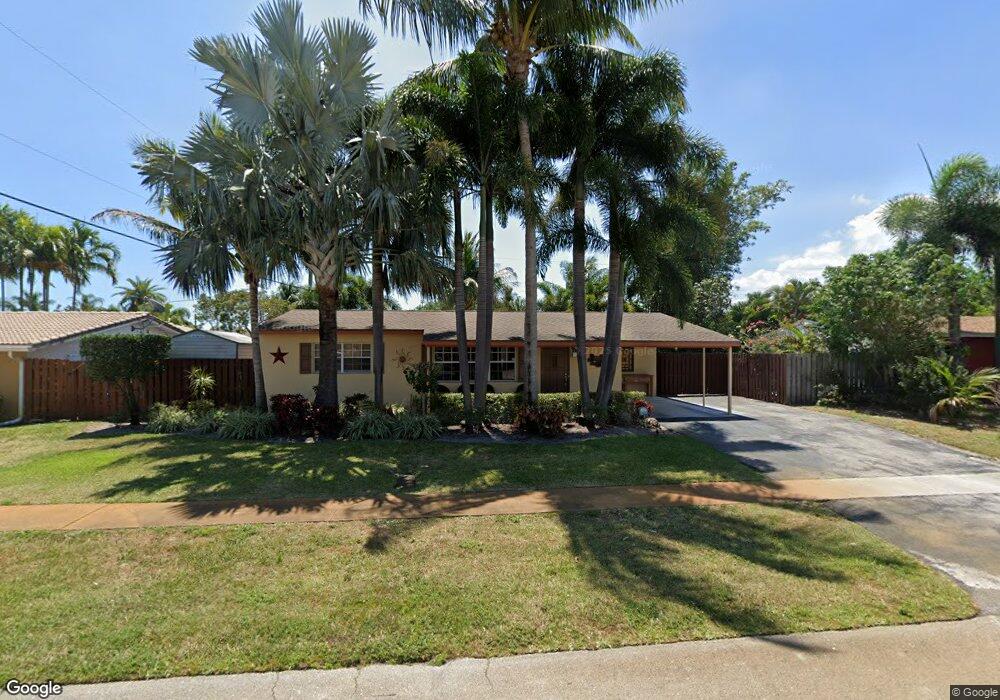
530 SE 3rd Place Deerfield Beach, FL 33441
Estimated Value: $430,000 - $544,000
2
Beds
2
Baths
1,160
Sq Ft
$425/Sq Ft
Est. Value
About This Home
This home is located at 530 SE 3rd Place, Deerfield Beach, FL 33441 and is currently estimated at $493,073, approximately $425 per square foot. 530 SE 3rd Place is a home located in Broward County with nearby schools including Deerfield Beach Elementary School, Deerfield Beach Middle School, and Deerfield Beach High School.
Ownership History
Date
Name
Owned For
Owner Type
Purchase Details
Closed on
May 12, 2022
Sold by
Knight and Katina
Bought by
Patten Clay Matthew and Stagner Taylor Lynn
Current Estimated Value
Home Financials for this Owner
Home Financials are based on the most recent Mortgage that was taken out on this home.
Original Mortgage
$504,400
Outstanding Balance
$476,587
Interest Rate
4.67%
Mortgage Type
New Conventional
Estimated Equity
$16,486
Purchase Details
Closed on
Mar 12, 1998
Sold by
Cook Bradford R and Cook Jean M
Bought by
Knight Seth and Knight Katina
Home Financials for this Owner
Home Financials are based on the most recent Mortgage that was taken out on this home.
Original Mortgage
$88,950
Interest Rate
7.07%
Mortgage Type
FHA
Purchase Details
Closed on
Oct 1, 1989
Sold by
Available Not
Bought by
Available Not
Create a Home Valuation Report for This Property
The Home Valuation Report is an in-depth analysis detailing your home's value as well as a comparison with similar homes in the area
Home Values in the Area
Average Home Value in this Area
Purchase History
| Date | Buyer | Sale Price | Title Company |
|---|---|---|---|
| Patten Clay Matthew | $520,000 | Gold Coast Settlement Services | |
| Knight Seth | $89,900 | -- | |
| Available Not | $57,357 | -- |
Source: Public Records
Mortgage History
| Date | Status | Borrower | Loan Amount |
|---|---|---|---|
| Open | Patten Clay Matthew | $504,400 | |
| Previous Owner | Knight Seth | $88,950 |
Source: Public Records
Tax History Compared to Growth
Tax History
| Year | Tax Paid | Tax Assessment Tax Assessment Total Assessment is a certain percentage of the fair market value that is determined by local assessors to be the total taxable value of land and additions on the property. | Land | Improvement |
|---|---|---|---|---|
| 2025 | $8,479 | $450,990 | -- | -- |
| 2024 | $8,284 | $438,280 | $28,030 | $397,490 |
| 2023 | $8,284 | $425,520 | $28,030 | $397,490 |
| 2022 | $6,800 | $306,630 | $0 | $0 |
| 2021 | $5,972 | $278,760 | $28,030 | $250,730 |
| 2020 | $5,678 | $264,690 | $28,030 | $236,660 |
| 2019 | $1,766 | $115,850 | $0 | $0 |
| 2018 | $1,644 | $113,690 | $0 | $0 |
| 2017 | $1,623 | $111,550 | $0 | $0 |
| 2016 | $1,613 | $109,260 | $0 | $0 |
| 2015 | $1,457 | $99,850 | $0 | $0 |
| 2014 | $1,466 | $99,060 | $0 | $0 |
| 2013 | -- | $157,820 | $28,030 | $129,790 |
Source: Public Records
Map
Nearby Homes
- 500 SE 4th St
- 711 SE 3rd St
- 271 SE 8th Ave
- 269 SE 8th Ave
- 367 S Federal Hwy Unit 209
- 367 S Federal Hwy Unit 323
- 367 S Federal Hwy Unit 326
- 367 S Federal Hwy Unit 321
- 367 S Federal Hwy Unit 206
- 370 SE 2nd Ave Unit G3
- 390 SE 2nd Ave Unit J3
- 340 SE 2nd Ave Unit D4
- 430 SE 2nd Ave Unit 4
- 440 SE 2nd Ave Unit 21
- 330 SE 2nd Ave Unit C2
- 262 SE 9th Ave Unit 1-4
- 29 SE 8th Ave
- 605 SE 8th Ave
- 43 SE 7th Ave
- 610 SE 2nd Ave Unit L4
- 520 SE 3rd Place
- 540 SE 3rd Place
- 531 SE 4th St
- 521 SE 4th St
- 531 SE 3rd Place
- 521 SE 3rd Place
- 541 SE 3rd Place
- 501 SE 4th St
- 501 SE 3rd Place
- 324 SE 6th Ave
- 440 SE 3rd Place
- 328 SE 6th Ave
- 441 SE 4th St
- 320 SE 6th Ave
- 530 SE 3rd Ct
- 530 SE 4th St
- 540 SE 4th St
- 540 SE 3rd Ct
- 520 SE 4th St
- 441 SE 3rd Place