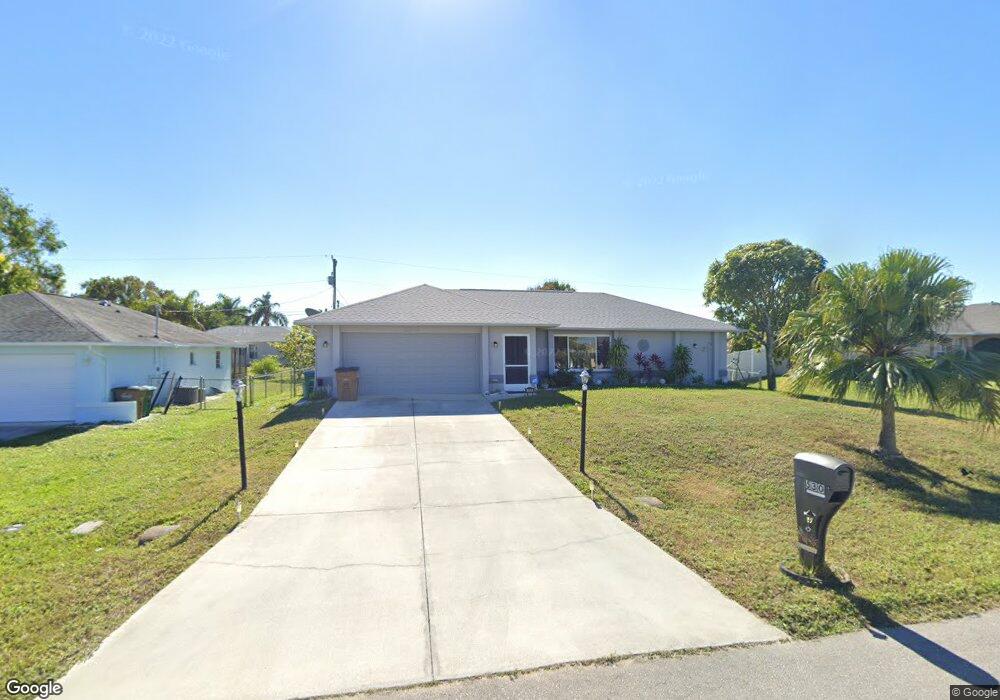
530 SE 3rd St Cape Coral, FL 33990
Hancock NeighborhoodEstimated Value: $304,000 - $408,000
3
Beds
3
Baths
2,234
Sq Ft
$164/Sq Ft
Est. Value
About This Home
This home is located at 530 SE 3rd St, Cape Coral, FL 33990 and is currently estimated at $366,271, approximately $163 per square foot. 530 SE 3rd St is a home located in Lee County with nearby schools including Caloosa Elementary School, Hancock Creek Elementary School, and Tropic Isles Elementary School.
Ownership History
Date
Name
Owned For
Owner Type
Purchase Details
Closed on
Jun 30, 2011
Sold by
White Terry
Bought by
Baker Debra Fayne
Current Estimated Value
Purchase Details
Closed on
May 18, 2000
Sold by
Mason Alita S and Hamilton Ivor M
Bought by
Fayne Charles
Home Financials for this Owner
Home Financials are based on the most recent Mortgage that was taken out on this home.
Original Mortgage
$73,600
Interest Rate
8.14%
Create a Home Valuation Report for This Property
The Home Valuation Report is an in-depth analysis detailing your home's value as well as a comparison with similar homes in the area
Home Values in the Area
Average Home Value in this Area
Purchase History
| Date | Buyer | Sale Price | Title Company |
|---|---|---|---|
| Baker Debra Fayne | -- | Attorney | |
| Fayne Charles | $92,000 | -- |
Source: Public Records
Mortgage History
| Date | Status | Borrower | Loan Amount |
|---|---|---|---|
| Previous Owner | Fayne Charles | $73,600 |
Source: Public Records
Tax History Compared to Growth
Tax History
| Year | Tax Paid | Tax Assessment Tax Assessment Total Assessment is a certain percentage of the fair market value that is determined by local assessors to be the total taxable value of land and additions on the property. | Land | Improvement |
|---|---|---|---|---|
| 2025 | $6,229 | $305,620 | -- | -- |
| 2024 | $5,840 | $277,836 | -- | -- |
| 2023 | $5,840 | $252,578 | $0 | $0 |
| 2022 | $5,476 | $229,616 | $0 | $0 |
| 2021 | $5,087 | $213,102 | $26,170 | $186,932 |
| 2020 | $4,631 | $189,765 | $25,000 | $164,765 |
| 2019 | $4,460 | $186,538 | $23,000 | $163,538 |
| 2018 | $4,264 | $176,836 | $24,000 | $152,836 |
| 2017 | $4,097 | $167,960 | $16,000 | $151,960 |
| 2016 | $3,929 | $160,652 | $17,119 | $143,533 |
| 2015 | $3,663 | $140,212 | $13,000 | $127,212 |
| 2014 | $3,360 | $115,409 | $9,024 | $106,385 |
| 2013 | -- | $108,489 | $4,800 | $103,689 |
Source: Public Records
Map
Nearby Homes
- 526 SE 3rd Terrace
- 522 SE 4th St
- 606 SE 4th St
- 531 SE 4th Terrace
- 527 SE 4th Terrace
- 536 SE 2nd Terrace
- 219 SE 5th Ave
- 617 SE 3rd Terrace
- 626 SE 4th St
- 1429 SE 4th Place
- 217 SE 4th Place
- 318 SE 4th Terrace
- 217 SE 7th Place
- 310 SE 3rd Terrace
- 526 SE 5th Place
- 537 SE 1st Terrace
- 321 Cultural Park Blvd
- 214 Cultural Park Blvd N
- 321 SE 2nd St
- 402 SE 1st Terrace
- 534 SE 3rd St
- 531 SE 3rd Terrace
- 535 SE 3rd Terrace
- 527 SE 3rd Terrace
- 538 SE 3rd St
- 522 SE 3rd St
- 531 SE 3rd St
- 527 SE 3rd St
- 539 SE 3rd Terrace
- 539 SE 3rd St
- 523 SE 3rd St
- 542 SE 3rd St
- 543 SE 3rd Terrace
- 543 SE 3rd St
- 532 SE 2nd Terrace
- 530 SE 3rd Terrace Unit 23
- 528 SE 2nd Terrace
- 302 SE 5th Place
- 526 SE 3rd Terrace Unit 23
- 602 SE 3rd St