530 South Ave Rockford, IL 61109
Estimated Value: $79,380 - $128,000
3
Beds
1
Bath
1,091
Sq Ft
$94/Sq Ft
Est. Value
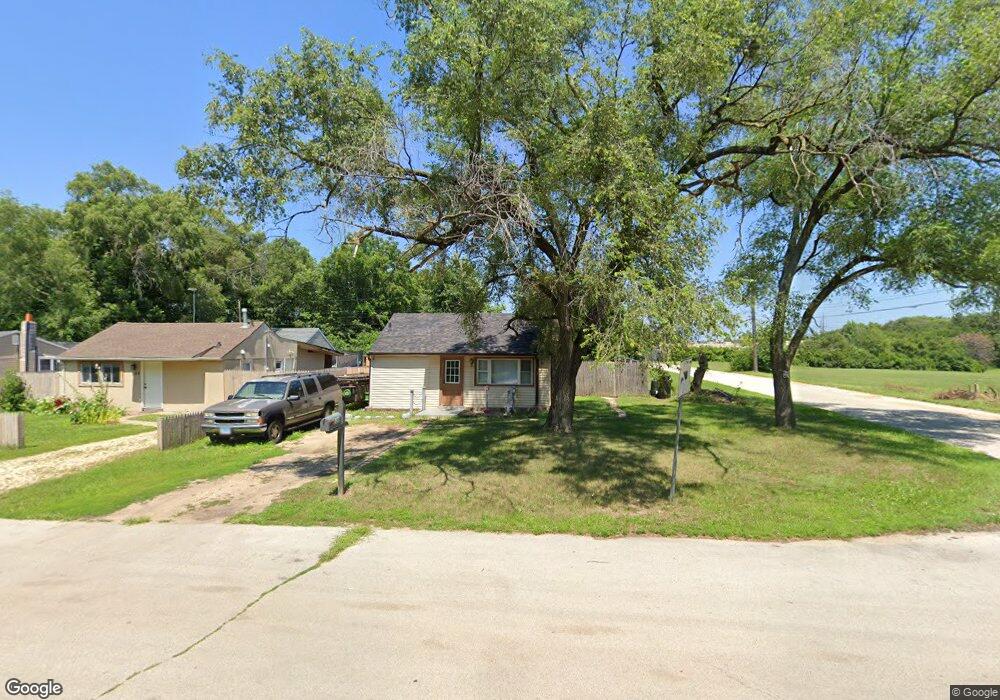
About This Home
This home is located at 530 South Ave, Rockford, IL 61109 and is currently estimated at $102,595, approximately $94 per square foot. 530 South Ave is a home located in Winnebago County with nearby schools including Riverdahl Elementary School, Rockford Environmental Science Academy, and Jefferson High School.
Ownership History
Date
Name
Owned For
Owner Type
Purchase Details
Closed on
Nov 8, 2024
Sold by
Hughes Ora L
Bought by
White Tyrone
Current Estimated Value
Purchase Details
Closed on
Dec 23, 2021
Sold by
Tyrone White
Bought by
Hughes Ora L
Purchase Details
Closed on
Jan 30, 2020
Sold by
White Tyrone and King Elizabeth
Bought by
White Tyrone
Purchase Details
Closed on
Oct 29, 2009
Bought by
Gilbert Roy and Gilbert Glenda
Create a Home Valuation Report for This Property
The Home Valuation Report is an in-depth analysis detailing your home's value as well as a comparison with similar homes in the area
Home Values in the Area
Average Home Value in this Area
Purchase History
| Date | Buyer | Sale Price | Title Company |
|---|---|---|---|
| White Tyrone | -- | None Listed On Document | |
| White Tyrone | -- | None Listed On Document | |
| Hughes Ora L | -- | None Listed On Document | |
| White Tyrone | -- | White Tyrone | |
| Gilbert Roy | $16,500 | -- |
Source: Public Records
Tax History Compared to Growth
Tax History
| Year | Tax Paid | Tax Assessment Tax Assessment Total Assessment is a certain percentage of the fair market value that is determined by local assessors to be the total taxable value of land and additions on the property. | Land | Improvement |
|---|---|---|---|---|
| 2024 | $1,128 | $11,900 | $594 | $11,306 |
| 2023 | $1,090 | $10,493 | $524 | $9,969 |
| 2022 | $1,071 | $9,378 | $468 | $8,910 |
| 2021 | $1,063 | $8,677 | $428 | $8,249 |
| 2020 | $1,055 | $8,203 | $405 | $7,798 |
| 2019 | $1,047 | $7,818 | $386 | $7,432 |
| 2018 | $1,115 | $7,816 | $365 | $7,451 |
| 2017 | $1,110 | $7,480 | $349 | $7,131 |
| 2016 | $1,109 | $7,339 | $342 | $6,997 |
| 2015 | $561 | $7,339 | $342 | $6,997 |
| 2014 | $1,155 | $7,765 | $428 | $7,337 |
Source: Public Records
Map
Nearby Homes