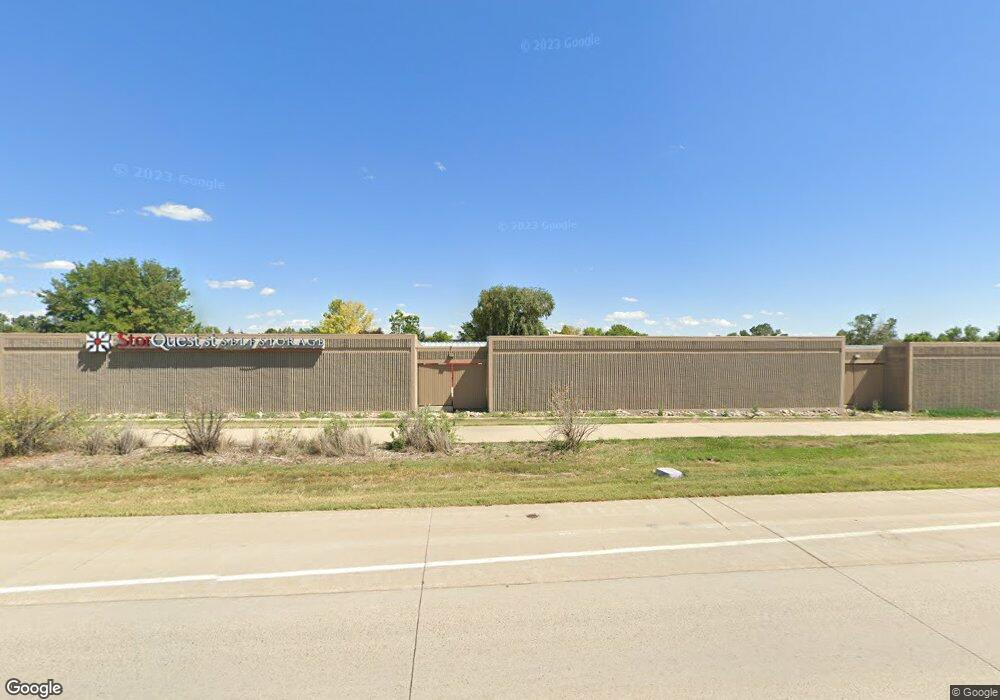
530 Stacy Ct Lafayette, CO 80026
Estimated Value: $14,209,234
2
Beds
1
Bath
70,517
Sq Ft
$202/Sq Ft
Est. Value
About This Home
This home is located at 530 Stacy Ct, Lafayette, CO 80026 and is currently estimated at $14,209,234, approximately $201 per square foot. 530 Stacy Ct is a home with nearby schools including Ryan Elementary School, Angevine Middle School, and Centaurus High School.
Ownership History
Date
Name
Owned For
Owner Type
Purchase Details
Closed on
Feb 3, 2014
Sold by
A-1 Storage Afton Llc
Bought by
530 Stacy Sp Llc
Current Estimated Value
Purchase Details
Closed on
Aug 23, 2007
Sold by
Forty-Five Llc
Bought by
A-1 Storage/Afton Llc
Home Financials for this Owner
Home Financials are based on the most recent Mortgage that was taken out on this home.
Original Mortgage
$4,100,000
Interest Rate
6.69%
Mortgage Type
Commercial
Purchase Details
Closed on
Oct 10, 1997
Sold by
Lafayette Invest Partnership Ltd
Bought by
Forty Five Ltd Liability Company
Home Financials for this Owner
Home Financials are based on the most recent Mortgage that was taken out on this home.
Original Mortgage
$2,465,000
Interest Rate
7.54%
Mortgage Type
Commercial
Purchase Details
Closed on
Jul 8, 1993
Bought by
530 Stacy Sp Llc
Create a Home Valuation Report for This Property
The Home Valuation Report is an in-depth analysis detailing your home's value as well as a comparison with similar homes in the area
Home Values in the Area
Average Home Value in this Area
Purchase History
| Date | Buyer | Sale Price | Title Company |
|---|---|---|---|
| 530 Stacy Sp Llc | $6,688,900 | None Available | |
| A-1 Storage/Afton Llc | $7,250,000 | Fidelity National Title Insu | |
| Forty Five Ltd Liability Company | $2,470,910 | -- | |
| 530 Stacy Sp Llc | -- | -- |
Source: Public Records
Mortgage History
| Date | Status | Borrower | Loan Amount |
|---|---|---|---|
| Previous Owner | A-1 Storage/Afton Llc | $4,100,000 | |
| Previous Owner | Forty Five Ltd Liability Company | $2,465,000 |
Source: Public Records
Tax History Compared to Growth
Tax History
| Year | Tax Paid | Tax Assessment Tax Assessment Total Assessment is a certain percentage of the fair market value that is determined by local assessors to be the total taxable value of land and additions on the property. | Land | Improvement |
|---|---|---|---|---|
| 2025 | $184,567 | $2,026,702 | $296,885 | $1,729,817 |
| 2024 | $184,567 | $2,026,702 | $296,885 | $1,729,817 |
| 2023 | $181,412 | $2,082,940 | $307,267 | $1,787,734 |
| 2022 | $174,822 | $1,861,156 | $272,954 | $1,588,202 |
| 2021 | $168,121 | $1,861,677 | $273,298 | $1,588,379 |
| 2020 | $171,039 | $1,871,444 | $273,298 | $1,598,146 |
| 2019 | $168,675 | $1,871,444 | $273,298 | $1,598,146 |
| 2018 | $151,209 | $1,656,342 | $274,886 | $1,381,456 |
| 2017 | $147,224 | $1,657,778 | $275,182 | $1,382,596 |
| 2016 | $138,353 | $1,506,916 | $250,047 | $1,256,869 |
| 2015 | $129,640 | $1,043,990 | $231,129 | $812,861 |
| 2014 | $90,272 | $1,043,990 | $231,129 | $812,861 |
Source: Public Records
Map
Nearby Homes
- 1418 Marigold Dr
- 1198 Milo Cir Unit A
- 1191 Milo Cir Unit A
- 1068 Milo Cir Unit A
- 1053 Delta Dr Unit B
- 1045 Milo Cir Unit A
- 1065 Delta Dr Unit A
- 1091 Milo Cir Unit B
- 998 Milo Cir Unit A
- 924 Milo Cir Unit A
- 1116 Elysian Field Dr Unit F
- 1115 Bacchus Dr Unit 1
- 911 Homer Cir
- 1111 Elysian Field Dr Unit D
- 299 Cheyenne Dr
- 335 Jackson St
- 1656 Lander Ln
- 1675 Saratoga Dr
- 880 Orion Dr
- 805 Argos Cir
- 505 Stacy Ct Unit E
- 505 Stacy Ct
- 525 Courtney Way
- 705 Old Wagon Trail Cir
- 1428 Marigold Dr
- 1422 Marigold Dr
- 505 Courtney Way
- 1455 Coal Creek Dr
- 1432 Marigold Dr
- 1408 Marigold Dr
- 711 Old Wagon Trail Cir
- 717 Old Wagon Trail Cir
- 974 Old Wagon Trail Cir
- 1438 Marigold Dr
- 1402 Marigold Dr
- 1442 Marigold Dr
- 723 Old Wagon Trail Cir
- 968 Old Wagon Trail Cir
- 1445 Coal Creek Dr
- 968 Old Wagon Trail Cir