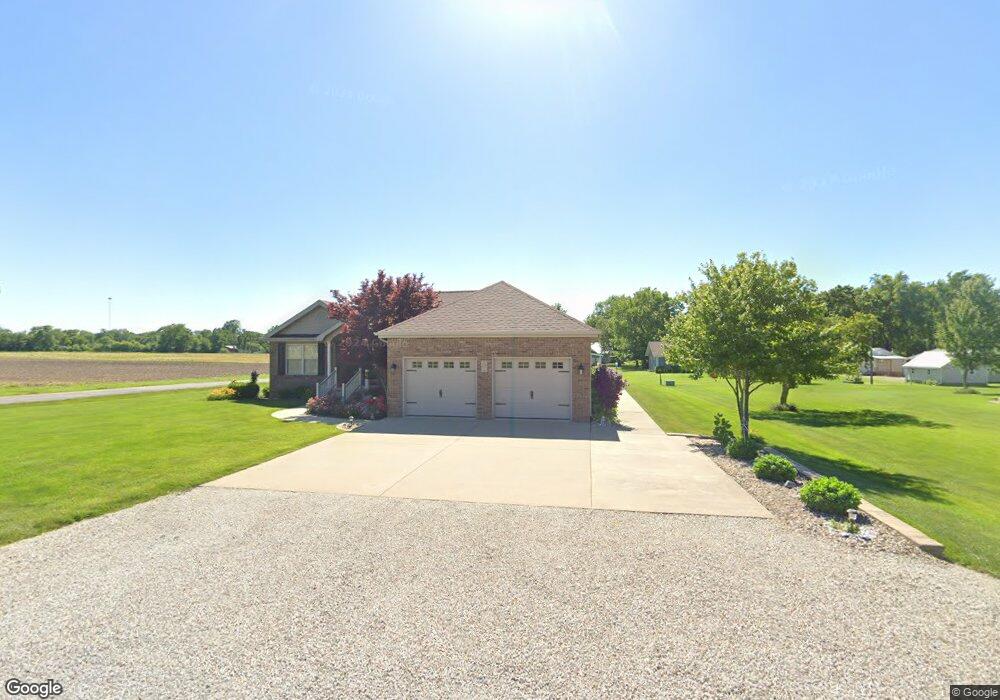
530 Stevens St Nokomis, IL 62075
Estimated Value: $123,000 - $248,000
--
Bed
--
Bath
--
Sq Ft
0.35
Acres
About This Home
This home is located at 530 Stevens St, Nokomis, IL 62075 and is currently estimated at $170,226. 530 Stevens St is a home located in Montgomery County with nearby schools including North Elementary School, Nokomis Junior/Senior High School, and St. Louis Catholic School.
Ownership History
Date
Name
Owned For
Owner Type
Purchase Details
Closed on
Jan 21, 2016
Sold by
Hamrock John and Hamrock Paula
Bought by
Janssen Alan Best and Janet Kay Janssen
Current Estimated Value
Purchase Details
Closed on
Mar 19, 2013
Sold by
Hamrock John Jeffery and Hamrock Paula Ann
Bought by
Hamrock John Jeffery and Paula Ann Hamrock
Purchase Details
Closed on
Jul 30, 2012
Sold by
King Jerry R
Bought by
Hamrock John and Hamrock Paula
Home Financials for this Owner
Home Financials are based on the most recent Mortgage that was taken out on this home.
Original Mortgage
$12,500
Interest Rate
3.65%
Mortgage Type
Commercial
Create a Home Valuation Report for This Property
The Home Valuation Report is an in-depth analysis detailing your home's value as well as a comparison with similar homes in the area
Home Values in the Area
Average Home Value in this Area
Purchase History
| Date | Buyer | Sale Price | Title Company |
|---|---|---|---|
| Janssen Alan Best | $12,500 | -- | |
| Hamrock John Jeffery | -- | -- | |
| Hamrock John | $12,500 | Community Title & Escrow | |
| Hamrock John | -- | Community Title & Escrow |
Source: Public Records
Mortgage History
| Date | Status | Borrower | Loan Amount |
|---|---|---|---|
| Previous Owner | Hamrock John | $12,500 |
Source: Public Records
Tax History Compared to Growth
Tax History
| Year | Tax Paid | Tax Assessment Tax Assessment Total Assessment is a certain percentage of the fair market value that is determined by local assessors to be the total taxable value of land and additions on the property. | Land | Improvement |
|---|---|---|---|---|
| 2024 | $4,123 | $53,410 | $1,730 | $51,680 |
| 2023 | $3,873 | $50,080 | $1,620 | $48,460 |
| 2022 | $3,781 | $48,130 | $1,560 | $46,570 |
| 2021 | $3,914 | $50,270 | $1,630 | $48,640 |
| 2020 | $3,735 | $47,950 | $1,550 | $46,400 |
| 2019 | $3,947 | $50,640 | $1,640 | $49,000 |
| 2018 | $3,805 | $47,670 | $1,540 | $46,130 |
| 2017 | $3,668 | $44,820 | $1,450 | $43,370 |
| 2016 | $3,666 | $43,590 | $1,410 | $42,180 |
| 2015 | $3,570 | $42,230 | $1,370 | $40,860 |
| 2013 | -- | $42,750 | $1,390 | $41,360 |
Source: Public Records
Map
Nearby Homes