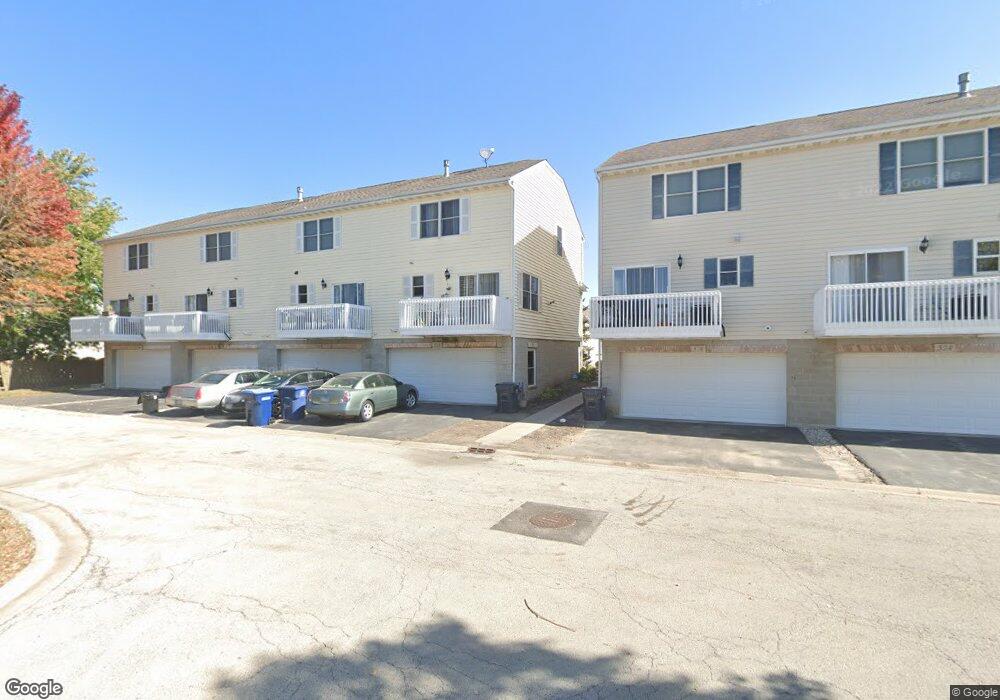
530 Susie Ln Cortland, IL 60112
Estimated Value: $196,000 - $217,893
3
Beds
2
Baths
1,400
Sq Ft
$149/Sq Ft
Est. Value
About This Home
This home is located at 530 Susie Ln, Cortland, IL 60112 and is currently estimated at $208,973, approximately $149 per square foot. 530 Susie Ln is a home located in DeKalb County with nearby schools including Cortland Elementary School, Huntley Middle School, and De Kalb High School.
Ownership History
Date
Name
Owned For
Owner Type
Purchase Details
Closed on
May 14, 2021
Sold by
Mathey John Eldon and Mathey Douglas
Bought by
Shott Kaylin M
Current Estimated Value
Purchase Details
Closed on
Oct 29, 2015
Sold by
Lawrence Gary and Lawrence Briana J
Bought by
Mathey John Eldon and Mathey Douglas
Home Financials for this Owner
Home Financials are based on the most recent Mortgage that was taken out on this home.
Original Mortgage
$89,300
Interest Rate
4.38%
Mortgage Type
New Conventional
Purchase Details
Closed on
Sep 30, 2005
Sold by
Brian Granger Construction Inc
Bought by
Lawrence Gary G
Home Financials for this Owner
Home Financials are based on the most recent Mortgage that was taken out on this home.
Original Mortgage
$146,680
Interest Rate
5.93%
Mortgage Type
New Conventional
Create a Home Valuation Report for This Property
The Home Valuation Report is an in-depth analysis detailing your home's value as well as a comparison with similar homes in the area
Home Values in the Area
Average Home Value in this Area
Purchase History
| Date | Buyer | Sale Price | Title Company |
|---|---|---|---|
| Shott Kaylin M | $145,000 | None Available | |
| Mathey John Eldon | $97,000 | -- | |
| Lawrence Gary G | $151,000 | -- |
Source: Public Records
Mortgage History
| Date | Status | Borrower | Loan Amount |
|---|---|---|---|
| Previous Owner | Mathey John Eldon | $89,300 | |
| Previous Owner | Lawrence Gary G | $146,680 |
Source: Public Records
Tax History Compared to Growth
Tax History
| Year | Tax Paid | Tax Assessment Tax Assessment Total Assessment is a certain percentage of the fair market value that is determined by local assessors to be the total taxable value of land and additions on the property. | Land | Improvement |
|---|---|---|---|---|
| 2024 | $4,736 | $59,225 | $5,271 | $53,954 |
| 2023 | $4,736 | $50,530 | $4,931 | $45,599 |
| 2022 | $4,805 | $48,225 | $4,706 | $43,519 |
| 2021 | $3,870 | $42,529 | $4,481 | $38,048 |
| 2020 | $3,857 | $41,202 | $4,341 | $36,861 |
| 2019 | $3,722 | $39,473 | $4,159 | $35,314 |
| 2018 | $3,280 | $34,655 | $3,933 | $30,722 |
| 2017 | $2,554 | $27,454 | $3,744 | $23,710 |
| 2016 | $2,411 | $25,803 | $3,519 | $22,284 |
| 2015 | -- | $24,231 | $3,305 | $20,926 |
| 2014 | -- | $23,322 | $3,181 | $20,141 |
| 2013 | -- | $24,168 | $3,296 | $20,872 |
Source: Public Records
Map
Nearby Homes
- 437 N Charles St Unit 7
- 42 W Auburndale Ave
- 353 N Aspen Dr
- 94 W Crabapple Ave
- 347 N Aspen Dr
- 341 N Aspen Dr
- 335 N Aspen Dr
- Lot C7 Crabapple Ave
- 329 N Aspen Dr
- Lot 2 Stonegate
- 300 N Aspen Dr
- LOT E7 W Bluebell Ave
- Lot D7 Bluebell
- 20 W Sandalwood Ave
- 20 Sandalwood Ave
- 37 W Sandalwood Ave
- 95 Lots Chestnut Grove
- Lot B5 W Paw Ave
- Lot B6 W Paw Ave
- 214 N Aspen Dr
- 534 Susie Ln Unit D8
- 532 Susie Ln Unit D7
- 532 Susie Ln
- 532 Susie Ln Unit 3126
- 530 Susie Ln Unit 3124
- 522 Susie Ln Unit 3114
- 522 Susie Ln
- 524 Susie Ln
- 3116 Susie Ln
- 3118 Susie Ln
- 3122 Susie Ln
- 528 Susie Ln Unit D5
- 522 Susie Ln
- 530 Susie Ln Unit D6
- 520 Susie Ln
- 526 Susie Ln
- 231 W Klein Ave Unit C5
- 231 Judy Ln
- 233 W Klein Ave Unit C4
- 233 Judy Ln