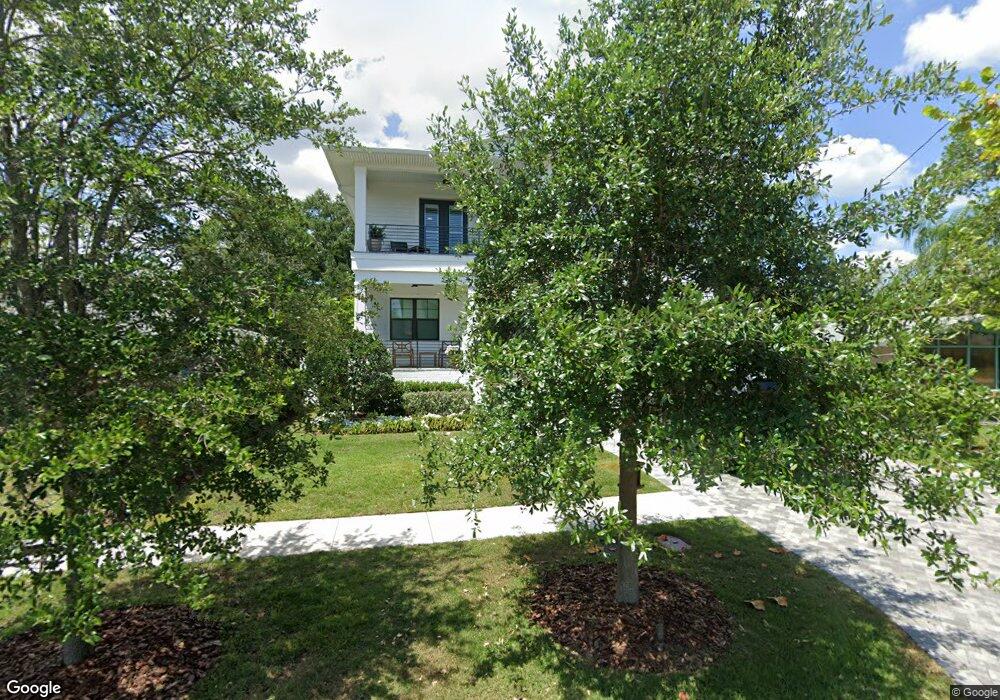
530 Suwanee Cir Tampa, FL 33606
Davis Islands NeighborhoodEstimated Value: $1,943,000 - $2,685,000
4
Beds
4
Baths
3,668
Sq Ft
$613/Sq Ft
Est. Value
About This Home
This home is located at 530 Suwanee Cir, Tampa, FL 33606 and is currently estimated at $2,247,155, approximately $612 per square foot. 530 Suwanee Cir is a home located in Hillsborough County with nearby schools including Gorrie Elementary School, Wilson Middle School, and Plant High School.
Ownership History
Date
Name
Owned For
Owner Type
Purchase Details
Closed on
Jan 26, 2018
Sold by
Ferguson Ii Jack W and Ferguson Jack W
Bought by
Markiewicz Austin and Markiewicz Erom
Current Estimated Value
Home Financials for this Owner
Home Financials are based on the most recent Mortgage that was taken out on this home.
Original Mortgage
$930,150
Outstanding Balance
$790,309
Interest Rate
4.12%
Mortgage Type
Small Business Administration
Estimated Equity
$1,456,846
Purchase Details
Closed on
Aug 24, 2012
Sold by
Slack James and Slack Maria Cristina
Bought by
Ferguson Ii Jack W
Home Financials for this Owner
Home Financials are based on the most recent Mortgage that was taken out on this home.
Original Mortgage
$243,000
Interest Rate
3.55%
Mortgage Type
New Conventional
Purchase Details
Closed on
Sep 24, 1998
Sold by
Grahn Elizabeth
Bought by
Slack James and Slack Maria C
Home Financials for this Owner
Home Financials are based on the most recent Mortgage that was taken out on this home.
Original Mortgage
$76,000
Interest Rate
6.92%
Mortgage Type
Purchase Money Mortgage
Create a Home Valuation Report for This Property
The Home Valuation Report is an in-depth analysis detailing your home's value as well as a comparison with similar homes in the area
Home Values in the Area
Average Home Value in this Area
Purchase History
| Date | Buyer | Sale Price | Title Company |
|---|---|---|---|
| Markiewicz Austin | $403,500 | Titlemark Llc | |
| Ferguson Ii Jack W | $270,000 | Attorney | |
| Slack James | $126,000 | -- |
Source: Public Records
Mortgage History
| Date | Status | Borrower | Loan Amount |
|---|---|---|---|
| Open | Markiewicz Austin | $930,150 | |
| Previous Owner | Ferguson Ii Jack W | $243,000 | |
| Previous Owner | Slack James | $76,000 |
Source: Public Records
Tax History Compared to Growth
Tax History
| Year | Tax Paid | Tax Assessment Tax Assessment Total Assessment is a certain percentage of the fair market value that is determined by local assessors to be the total taxable value of land and additions on the property. | Land | Improvement |
|---|---|---|---|---|
| 2024 | $15,687 | $851,704 | -- | -- |
| 2023 | $15,334 | $826,897 | $0 | $0 |
| 2022 | $14,961 | $802,813 | $0 | $0 |
| 2021 | $14,810 | $779,430 | $0 | $0 |
| 2020 | $14,688 | $768,669 | $0 | $0 |
| 2019 | $6,008 | $299,970 | $299,970 | $0 |
| 2018 | $6,811 | $327,822 | $0 | $0 |
| 2017 | $4,566 | $312,842 | $0 | $0 |
| 2016 | $4,431 | $252,260 | $0 | $0 |
| 2015 | $4,432 | $250,506 | $0 | $0 |
| 2014 | $4,374 | $248,518 | $0 | $0 |
| 2013 | -- | $244,845 | $0 | $0 |
Source: Public Records
Map
Nearby Homes
- 555 Suwanee Cir
- 545 Suwanee Cir
- 650 Geneva Place
- 513 Suwanee Cir
- 642 Geneva Place
- 572 Marmora Ave
- 456 Marmora Ave
- 560 Bosphorous Ave
- 511 Erie Ave
- 637 Jamaica Ave
- 515 Bosphorous Ave
- 690 Geneva Place
- 485 Bosphorous Ave
- 601 Bosphorous Ave
- 605 Bosphorous Ave
- 628 Bosphorous Ave
- 593 Marmora Ave
- 481 Bosphorous Ave
- 615 Marmora Ave
- 451 W Davis Blvd
- 528 Suwanee Cir
- 532 Suwanee Cir
- 506 Suwanee Cir
- 508 Suwanee Cir
- 504 Suwanee Cir
- 510 Suwanee Cir
- 502 Suwanee Cir
- 496 Suwanee Cir
- 498 Suwanee Cir
- 551 Suwanee Cir
- 553 Suwanee Cir
- 549 Suwanee Cir
- 522 Suwanee Cir
- 494 Suwanee Cir
- 514 Suwanee Cir
- 520 Suwanee Cir
- 563 Suwanee Cir
- 516 Suwanee Cir
- 507 Suwanee Cir
- 509 Suwanee Cir