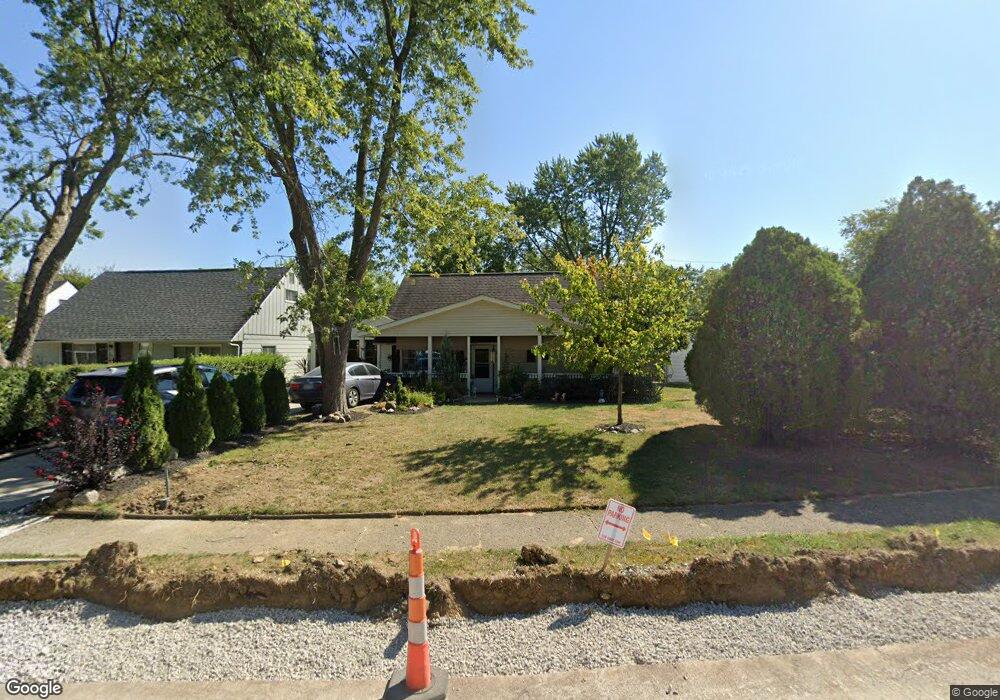
530 Virginia Cir W Columbus, OH 43213
Estimated Value: $184,656 - $209,000
4
Beds
1
Bath
1,207
Sq Ft
$167/Sq Ft
Est. Value
About This Home
This home is located at 530 Virginia Cir W, Columbus, OH 43213 and is currently estimated at $201,164, approximately $166 per square foot. 530 Virginia Cir W is a home located in Franklin County with nearby schools including Beechwood Elementary School, Etna Road Elementary School, and Rosemore Middle School.
Ownership History
Date
Name
Owned For
Owner Type
Purchase Details
Closed on
Jul 16, 2020
Sold by
Sweatland Mark L and Sweatland Renee
Bought by
Luna Juan Carlos and Luna Katherine Louise
Current Estimated Value
Home Financials for this Owner
Home Financials are based on the most recent Mortgage that was taken out on this home.
Original Mortgage
$132,554
Outstanding Balance
$117,540
Interest Rate
3.1%
Mortgage Type
FHA
Estimated Equity
$83,624
Purchase Details
Closed on
May 27, 2011
Sold by
Winnesraffer Richard A and Firstmerritt Bank Na
Bought by
Sweatland Mark L
Purchase Details
Closed on
Jan 11, 2001
Sold by
Price Richard L and Price Stephanie G
Bought by
Winnestaffer Richard A
Home Financials for this Owner
Home Financials are based on the most recent Mortgage that was taken out on this home.
Original Mortgage
$66,400
Interest Rate
7.69%
Purchase Details
Closed on
Oct 31, 1990
Create a Home Valuation Report for This Property
The Home Valuation Report is an in-depth analysis detailing your home's value as well as a comparison with similar homes in the area
Home Values in the Area
Average Home Value in this Area
Purchase History
| Date | Buyer | Sale Price | Title Company |
|---|---|---|---|
| Luna Juan Carlos | $135,000 | Stewart Ttl Agcy Of Cols Ltd | |
| Sweatland Mark L | $32,550 | None Available | |
| Winnestaffer Richard A | $63,000 | The Title Co Ltd | |
| -- | $45,000 | -- |
Source: Public Records
Mortgage History
| Date | Status | Borrower | Loan Amount |
|---|---|---|---|
| Open | Luna Juan Carlos | $132,554 | |
| Previous Owner | Winnestaffer Richard A | $66,400 |
Source: Public Records
Tax History Compared to Growth
Tax History
| Year | Tax Paid | Tax Assessment Tax Assessment Total Assessment is a certain percentage of the fair market value that is determined by local assessors to be the total taxable value of land and additions on the property. | Land | Improvement |
|---|---|---|---|---|
| 2024 | $2,018 | $46,170 | $17,290 | $28,880 |
| 2023 | $2,004 | $46,165 | $17,290 | $28,875 |
| 2022 | $1,492 | $26,120 | $5,430 | $20,690 |
| 2021 | $1,401 | $26,120 | $5,430 | $20,690 |
| 2020 | $1,423 | $26,120 | $5,430 | $20,690 |
| 2019 | $1,288 | $20,550 | $4,340 | $16,210 |
| 2018 | $1,024 | $20,550 | $4,340 | $16,210 |
| 2017 | $988 | $20,550 | $4,340 | $16,210 |
| 2016 | $729 | $10,850 | $5,670 | $5,180 |
| 2015 | $735 | $10,850 | $5,670 | $5,180 |
| 2014 | $735 | $10,850 | $5,670 | $5,180 |
| 2013 | $350 | $10,850 | $5,670 | $5,180 |
Source: Public Records
Map
Nearby Homes
- 526 Collingwood Ave
- 3811 Brentwood Ct
- 320 Collingwood Ave
- 3814 Elbern Ave
- 4148 Elbern Ave
- 4094 E Main St
- 798 S Yearling Rd
- 4144 Mcallister Ave
- 91 Robinwood Ave
- 579 Westphal Ave
- 4368 Broadhurst Dr
- 647 S Napoleon Ave
- 931 E Fulton St
- 963 Erickson Ave
- 646 S Weyant Ave
- 91 Maplewood Ave
- 733 S Napoleon Ave
- 3955 E Fulton St
- 178 S Weyant Ave
- 201 S Weyant Ave
- 526 Virginia Cir W
- 550 Virginia Cir W
- 520 Virginia Cir W
- 543 Beechwood Rd
- 537 Beechwood Rd
- 549 Beechwood Rd
- 514 Virginia Cir W
- 531 Beechwood Rd
- 533 Virginia Cir W
- 525 Virginia Cir W
- 541 Virginia Cir W
- 525 Beechwood Rd
- 555 Virginia Cir W
- 508 Virginia Cir W
- 519 Virginia Cir W
- 549 Virginia Cir W
- 513 Virginia Cir W
- 517 Beechwood Rd
- 502 Virginia Cir W
- 559 Virginia Cir W