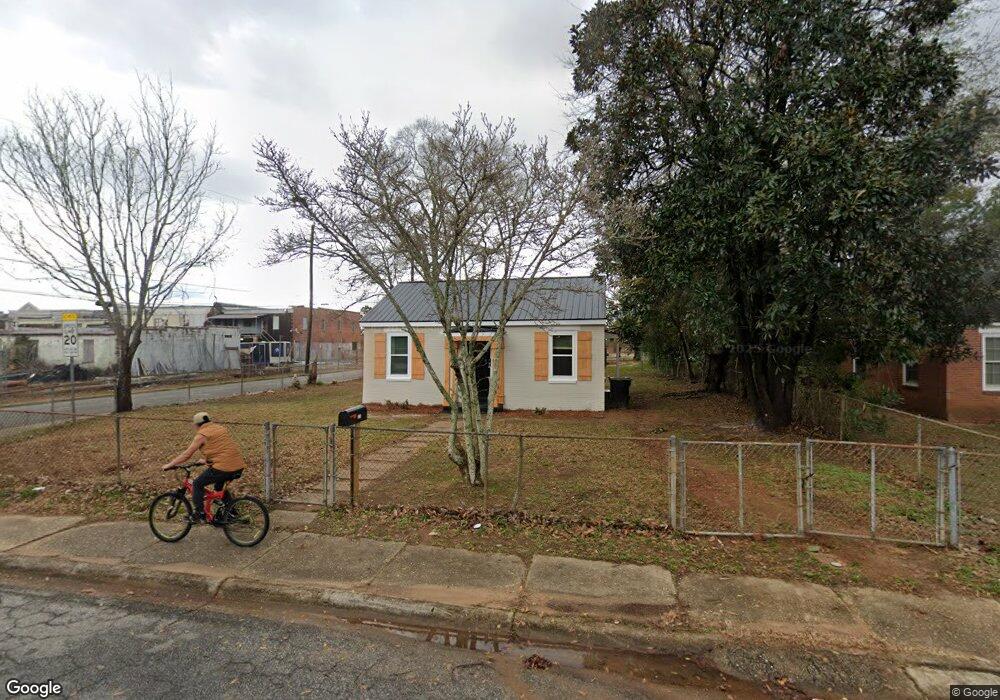
530 Walnut St Columbus, GA 31904
North Highlands NeighborhoodEstimated Value: $76,000 - $97,000
2
Beds
2
Baths
725
Sq Ft
$117/Sq Ft
Est. Value
About This Home
This home is located at 530 Walnut St, Columbus, GA 31904 and is currently estimated at $85,061, approximately $117 per square foot. 530 Walnut St is a home located in Muscogee County with nearby schools including Fox Elementary School, Double Churches Middle School, and Jordan Vocational High School.
Ownership History
Date
Name
Owned For
Owner Type
Purchase Details
Closed on
May 22, 2025
Sold by
Benson Nicholas Adam and Benson Laura Davis
Bought by
Benson Real Estate Georgia Llc
Current Estimated Value
Purchase Details
Closed on
Jan 23, 2025
Sold by
Patrick Poole Investments Llc
Bought by
Benson Nicholas A and Benson Laura D
Purchase Details
Closed on
Dec 4, 2024
Sold by
Columbus Neighborworks and Columbus Housing Initiative Inc
Bought by
Patrick Poole Investments Llc
Purchase Details
Closed on
Jun 2, 2021
Sold by
Columbus Neighborworks
Bought by
Ruff Courtney Jamar
Purchase Details
Closed on
Mar 26, 2019
Sold by
Chi Asset Management Llc
Bought by
Columbus Housing Initiative Inc
Home Financials for this Owner
Home Financials are based on the most recent Mortgage that was taken out on this home.
Original Mortgage
$144,387
Interest Rate
4.3%
Mortgage Type
New Conventional
Purchase Details
Closed on
Sep 5, 2018
Sold by
Ellenburg Myrtle Lee
Bought by
Chi Asset Management Llc
Create a Home Valuation Report for This Property
The Home Valuation Report is an in-depth analysis detailing your home's value as well as a comparison with similar homes in the area
Home Values in the Area
Average Home Value in this Area
Purchase History
| Date | Buyer | Sale Price | Title Company |
|---|---|---|---|
| Benson Real Estate Georgia Llc | -- | None Listed On Document | |
| Benson Nicholas A | $77,500 | None Listed On Document | |
| Patrick Poole Investments Llc | $15,000 | None Listed On Document | |
| Ruff Courtney Jamar | $130,800 | None Listed On Document | |
| Columbus Housing Initiative Inc | -- | -- | |
| Chi Asset Management Llc | $20,000 | -- |
Source: Public Records
Mortgage History
| Date | Status | Borrower | Loan Amount |
|---|---|---|---|
| Previous Owner | Columbus Housing Initiative Inc | $144,387 |
Source: Public Records
Tax History Compared to Growth
Tax History
| Year | Tax Paid | Tax Assessment Tax Assessment Total Assessment is a certain percentage of the fair market value that is determined by local assessors to be the total taxable value of land and additions on the property. | Land | Improvement |
|---|---|---|---|---|
| 2025 | $122 | $31,212 | $4,996 | $26,216 |
| 2024 | $690 | $17,632 | $4,996 | $12,636 |
| 2023 | $695 | $17,632 | $4,996 | $12,636 |
| 2022 | $521 | $12,756 | $3,496 | $9,260 |
| 2021 | $486 | $11,888 | $3,496 | $8,392 |
| 2020 | $486 | $11,888 | $3,496 | $8,392 |
| 2019 | $328 | $8,000 | $2,400 | $5,600 |
| 2018 | $2 | $11,556 | $3,496 | $8,060 |
| 2017 | $3 | $11,556 | $3,496 | $8,060 |
| 2016 | $3 | $10,675 | $1,300 | $9,375 |
| 2015 | $1 | $10,675 | $1,300 | $9,375 |
| 2014 | $4 | $10,675 | $1,300 | $9,375 |
| 2013 | $5 | $10,675 | $1,300 | $9,375 |
Source: Public Records
Map
Nearby Homes