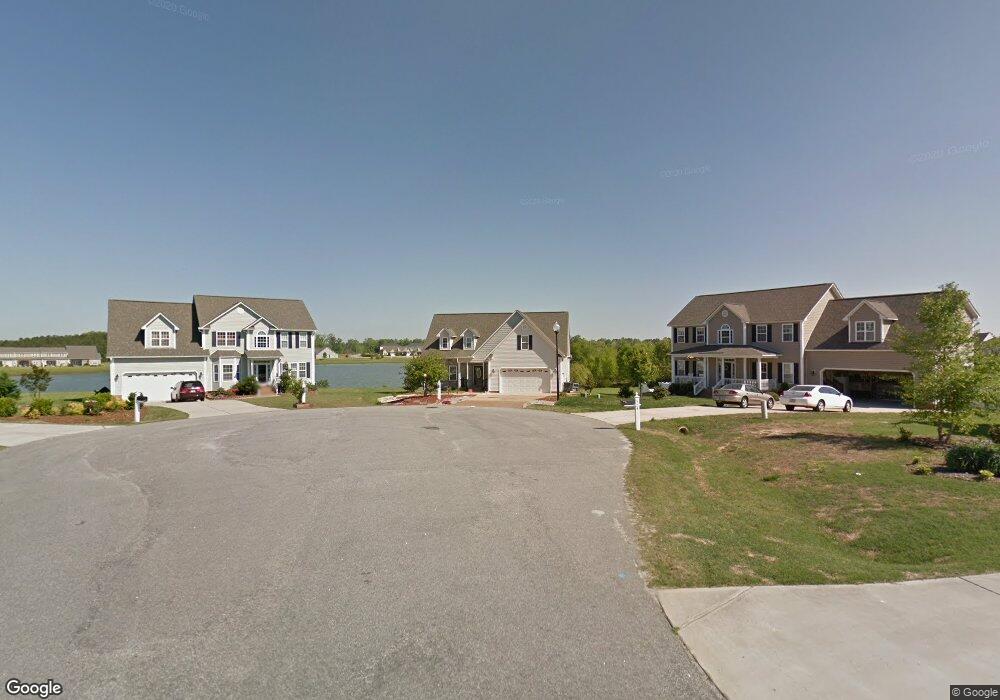
530 Windgate Dr Clayton, NC 27527
Wilders NeighborhoodEstimated Value: $436,000 - $457,000
3
Beds
3
Baths
2,750
Sq Ft
$162/Sq Ft
Est. Value
About This Home
This home is located at 530 Windgate Dr, Clayton, NC 27527 and is currently estimated at $444,392, approximately $161 per square foot. 530 Windgate Dr is a home located in Johnston County with nearby schools including River Dell Elementary School, Archer Lodge Middle School, and Corinth Holders High School.
Ownership History
Date
Name
Owned For
Owner Type
Purchase Details
Closed on
Jun 11, 2015
Sold by
Colfin Ah North Carolina 1 Llc
Bought by
Cah 2015 1 Borrower Llc
Current Estimated Value
Home Financials for this Owner
Home Financials are based on the most recent Mortgage that was taken out on this home.
Original Mortgage
$673,762
Outstanding Balance
$522,591
Interest Rate
3.79%
Mortgage Type
Commercial
Estimated Equity
-$78,199
Purchase Details
Closed on
Sep 10, 2014
Sold by
Denaut Michael J and Denaut Evan M
Bought by
Colfin Ah North Carolina 1 Llc
Purchase Details
Closed on
Jun 20, 2008
Sold by
Robert Massengill Construction Inc
Bought by
Denaut Michael J and Denaut Eva M
Home Financials for this Owner
Home Financials are based on the most recent Mortgage that was taken out on this home.
Original Mortgage
$147,600
Interest Rate
5.96%
Mortgage Type
Purchase Money Mortgage
Purchase Details
Closed on
Jul 3, 2007
Sold by
Royal Flush Development Llc
Bought by
Robert Massengill Construction Inc
Create a Home Valuation Report for This Property
The Home Valuation Report is an in-depth analysis detailing your home's value as well as a comparison with similar homes in the area
Home Values in the Area
Average Home Value in this Area
Purchase History
| Date | Buyer | Sale Price | Title Company |
|---|---|---|---|
| Cah 2015 1 Borrower Llc | -- | Os National Llc | |
| Colfin Ah North Carolina 1 Llc | $209,500 | None Available | |
| Denaut Michael J | $246,000 | None Available | |
| Robert Massengill Construction Inc | $223,000 | None Available |
Source: Public Records
Mortgage History
| Date | Status | Borrower | Loan Amount |
|---|---|---|---|
| Open | Cah 2015 1 Borrower Llc | $673,762 | |
| Previous Owner | Denaut Michael J | $147,600 |
Source: Public Records
Tax History Compared to Growth
Tax History
| Year | Tax Paid | Tax Assessment Tax Assessment Total Assessment is a certain percentage of the fair market value that is determined by local assessors to be the total taxable value of land and additions on the property. | Land | Improvement |
|---|---|---|---|---|
| 2025 | $2,777 | $437,360 | $85,000 | $352,360 |
| 2024 | $2,154 | $265,900 | $48,000 | $217,900 |
| 2023 | $2,154 | $265,900 | $48,000 | $217,900 |
| 2022 | $2,180 | $265,900 | $48,000 | $217,900 |
| 2021 | $2,180 | $265,900 | $48,000 | $217,900 |
| 2020 | $2,260 | $265,900 | $48,000 | $217,900 |
| 2019 | $2,260 | $265,900 | $48,000 | $217,900 |
| 2018 | $2,048 | $235,410 | $35,000 | $200,410 |
| 2017 | $2,001 | $235,410 | $35,000 | $200,410 |
| 2016 | $2,001 | $235,410 | $35,000 | $200,410 |
| 2015 | -- | $235,410 | $35,000 | $200,410 |
| 2014 | -- | $235,410 | $35,000 | $200,410 |
Source: Public Records
Map
Nearby Homes
- 459 Windgate Dr
- 323 Windgate Dr
- 347 Manchester Trail
- 270 Wembley Dr
- 312 S Kramer Path
- 68 Radcliffe Ct
- 109 Manchester Trail
- 78 Radcliffe Ct
- 260 Ainsley Ct
- 91 E Walker Woods Ln
- 2276 Castleberry Rd
- 478 Curling Creek Dr
- 107 Stargrass Ave
- 92 Summer Mist Ln
- 92 Summer Mist Ln Unit 164p
- 80 Summer Mist Ln
- 80 Summer Mist Ln Unit 165p
- TA3000 Plan at Copper Ridge at Flowers Plantation
- Abigale Plan at Copper Ridge at Flowers Plantation
- TA2300 Plan at Copper Ridge at Flowers Plantation
- 530 Windgate Dr Unit L 189
- 524 Windgate Dr
- 529 Windgate Dr
- 510 Windgate Dr
- 510 Windgate Dr Unit L 187
- 523 Windgate Dr
- 509 Windgate Dr
- 492 Windgate Dr
- 466 Windgate Dr
- 484 Manchester Trail
- 459 Manchester Trail
- 464 Manchester Trail
- 450 Windgate Dr
- 456 Manchester Trail
- 439 Manchester Trail
- 142 Hocutt Farm Dr
- 142 Hocutt Farm Dr Unit 1
- 128 Hocutt Farm Dr
- 128 Hocutt Farm Dr Unit 2
- 114 Hocutt Farm Dr