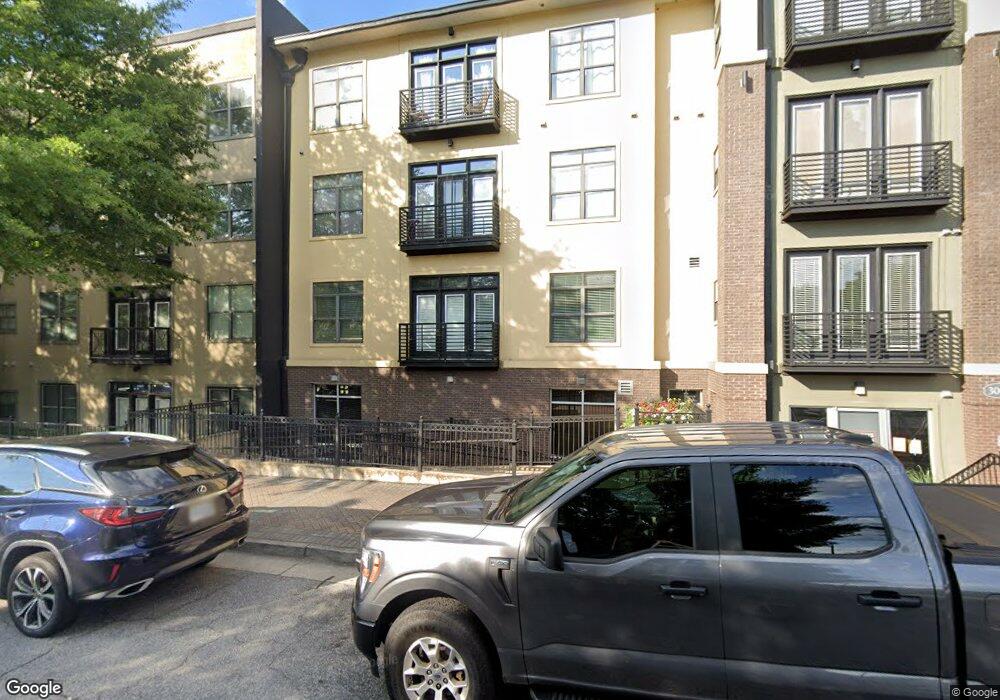
The Lofts at 5300 5300 Peachtree Rd Unit 1211 Chamblee, GA 30341
Estimated Value: $240,813 - $264,000
1
Bed
1
Bath
713
Sq Ft
$348/Sq Ft
Est. Value
About This Home
This home is located at 5300 Peachtree Rd Unit 1211, Chamblee, GA 30341 and is currently estimated at $248,453, approximately $348 per square foot. 5300 Peachtree Rd Unit 1211 is a home located in DeKalb County with nearby schools including Huntley Hills Elementary School, Chamblee Middle School, and Chamblee Charter High School.
Ownership History
Date
Name
Owned For
Owner Type
Purchase Details
Closed on
Oct 19, 2016
Sold by
Phyllis C Willich
Bought by
Jackson Tory
Current Estimated Value
Home Financials for this Owner
Home Financials are based on the most recent Mortgage that was taken out on this home.
Original Mortgage
$137,357
Outstanding Balance
$110,152
Interest Rate
3.47%
Estimated Equity
$138,301
Purchase Details
Closed on
May 26, 2016
Sold by
Conter Michael
Bought by
Cancela David R
Home Financials for this Owner
Home Financials are based on the most recent Mortgage that was taken out on this home.
Original Mortgage
$133,375
Interest Rate
3.66%
Mortgage Type
New Conventional
Purchase Details
Closed on
Jun 23, 2006
Sold by
5300 Peachtree
Bought by
Conter Michael
Home Financials for this Owner
Home Financials are based on the most recent Mortgage that was taken out on this home.
Original Mortgage
$143,463
Interest Rate
6.55%
Mortgage Type
New Conventional
Create a Home Valuation Report for This Property
The Home Valuation Report is an in-depth analysis detailing your home's value as well as a comparison with similar homes in the area
Home Values in the Area
Average Home Value in this Area
Purchase History
| Date | Buyer | Sale Price | Title Company |
|---|---|---|---|
| Jackson Tory | -- | -- | |
| Cancela David R | $137,500 | -- | |
| Conter Michael | $147,900 | -- |
Source: Public Records
Mortgage History
| Date | Status | Borrower | Loan Amount |
|---|---|---|---|
| Open | Jackson Tory | $137,357 | |
| Closed | Jackson Tory | -- | |
| Previous Owner | Cancela David R | $133,375 | |
| Previous Owner | Conter Michael | $143,463 |
Source: Public Records
Tax History Compared to Growth
Tax History
| Year | Tax Paid | Tax Assessment Tax Assessment Total Assessment is a certain percentage of the fair market value that is determined by local assessors to be the total taxable value of land and additions on the property. | Land | Improvement |
|---|---|---|---|---|
| 2025 | $2,441 | $93,960 | $20,000 | $73,960 |
| 2024 | $2,211 | $88,600 | $20,000 | $68,600 |
| 2023 | $2,211 | $87,880 | $20,000 | $67,880 |
| 2022 | $1,839 | $77,360 | $14,160 | $63,200 |
| 2021 | $1,602 | $70,680 | $14,160 | $56,520 |
| 2020 | $1,526 | $67,160 | $14,160 | $53,000 |
| 2019 | $1,495 | $62,520 | $11,600 | $50,920 |
| 2018 | $1,569 | $57,840 | $11,600 | $46,240 |
| 2017 | $1,393 | $53,360 | $11,600 | $41,760 |
| 2016 | $1,929 | $44,880 | $14,160 | $30,720 |
| 2014 | $1,489 | $34,200 | $14,160 | $20,040 |
Source: Public Records
About The Lofts at 5300
Map
Nearby Homes
- 5300 Peachtree Rd Unit 1608
- 5300 Peachtree Rd Unit 4513
- 5300 Peachtree Rd Unit 3601
- 5300 Peachtree Rd Unit 2309
- 5300 Peachtree Rd Unit 2401
- 5300 Peachtree Rd Unit 2310
- 5300 Peachtree Rd Unit 3207
- 5300 Peachtree Rd Unit 2605
- 5300 Peachtree Rd Unit 4514
- 5300 Peachtree Rd Unit 3308
- 5300 Peachtree Rd Unit 3507
- 2142 Dowdell Dr
- 3400 Malone Dr Unit 206
- 5200 Peachtree Rd Unit 2114
- 2142 Bristol Cove
- 2150 Bristol Cove
- 5139 Peachtree Rd
- 1952 Wingate Rd
- 3715 Benton Ln
- 1861 Dyer Cir
- 5300 Peachtree Rd Unit 1308
- 5300 Peachtree Rd Unit 3308
- 5300 Peachtree Rd Unit 4608
- 5300 Peachtree Rd Unit 2209
- 5300 Peachtree Rd Unit 211`
- 5300 Peachtree Rd
- 5300 Peachtree Rd Unit 3307
- 5300 Peachtree Rd Unit 2503
- 5300 Peachtree Rd Unit 1102
- 5300 Peachtree Rd Unit 3212
- 5300 Peachtree Rd Unit 212
- 5300 Peachtree Rd Unit 2403
- 5300 Peachtree Rd Unit 310
- 5300 Peachtree Rd Unit 1509
- 5300 Peachtree Rd Unit 4307
- 5300 Peachtree Rd Unit 509
- 5300 Peachtree Rd Unit 1609
- 5300 Peachtree Rd Unit 4405
- 5300 Peachtree Rd Unit 3104
- 5300 Peachtree Rd Unit 201