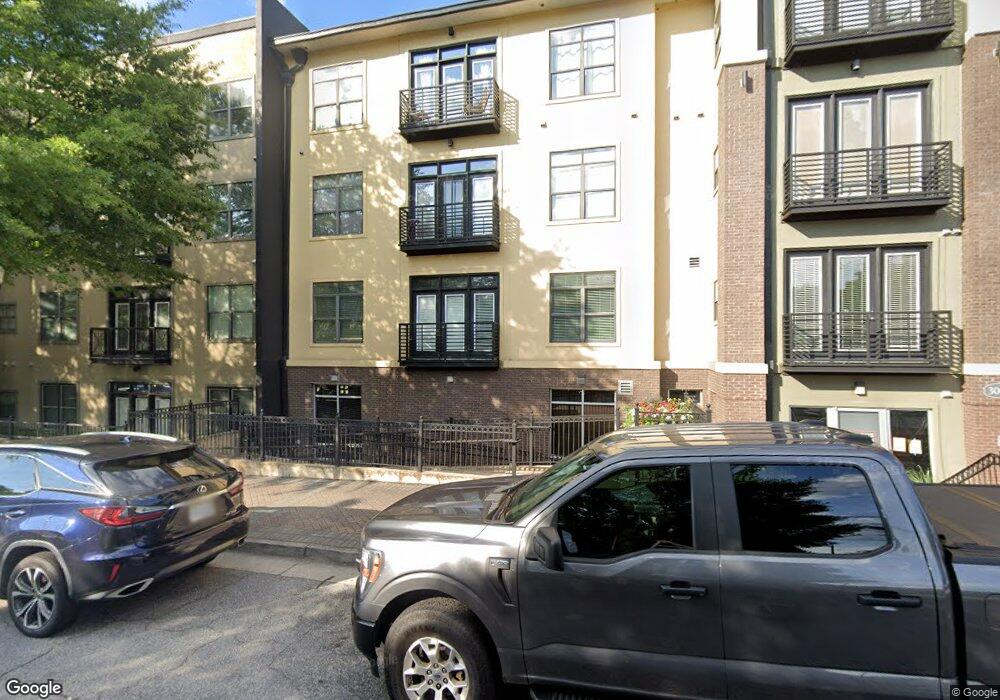
The Lofts at 5300 5300 Peachtree Rd Unit 509 Chamblee, GA 30341
Estimated Value: $323,403 - $365,000
2
Beds
2
Baths
1,240
Sq Ft
$277/Sq Ft
Est. Value
About This Home
This home is located at 5300 Peachtree Rd Unit 509, Chamblee, GA 30341 and is currently estimated at $343,101, approximately $276 per square foot. 5300 Peachtree Rd Unit 509 is a home located in DeKalb County with nearby schools including Huntley Hills Elementary School, Chamblee Middle School, and Chamblee Charter High School.
Ownership History
Date
Name
Owned For
Owner Type
Purchase Details
Closed on
Sep 27, 2019
Sold by
Nichols Charles V
Bought by
Marshburn John Howard
Current Estimated Value
Home Financials for this Owner
Home Financials are based on the most recent Mortgage that was taken out on this home.
Original Mortgage
$269,660
Outstanding Balance
$235,714
Interest Rate
3.5%
Mortgage Type
New Conventional
Estimated Equity
$107,387
Purchase Details
Closed on
Nov 18, 2016
Sold by
Allen K
Bought by
Nichols V Charles and Nichols Aisha J
Home Financials for this Owner
Home Financials are based on the most recent Mortgage that was taken out on this home.
Original Mortgage
$215,033
Interest Rate
3.49%
Mortgage Type
FHA
Purchase Details
Closed on
Jun 5, 2014
Sold by
Black Tommie
Bought by
Black Tommie and Black Allen K
Purchase Details
Closed on
Mar 27, 2012
Sold by
Domus Grp Llc
Bought by
Black Tommie
Create a Home Valuation Report for This Property
The Home Valuation Report is an in-depth analysis detailing your home's value as well as a comparison with similar homes in the area
Home Values in the Area
Average Home Value in this Area
Purchase History
| Date | Buyer | Sale Price | Title Company |
|---|---|---|---|
| Marshburn John Howard | $278,000 | -- | |
| Marshburn John Howard | $278,000 | -- | |
| Nichols V Charles | $219,000 | -- | |
| Nichols V Charles | $219,000 | -- | |
| Black Tommie | -- | -- | |
| Black Tommie | -- | -- | |
| Black Tommie | $136,000 | -- | |
| Black Tommie | $136,000 | -- |
Source: Public Records
Mortgage History
| Date | Status | Borrower | Loan Amount |
|---|---|---|---|
| Open | Marshburn John Howard | $269,660 | |
| Previous Owner | Nichols V Charles | $215,033 |
Source: Public Records
Tax History
| Year | Tax Paid | Tax Assessment Tax Assessment Total Assessment is a certain percentage of the fair market value that is determined by local assessors to be the total taxable value of land and additions on the property. | Land | Improvement |
|---|---|---|---|---|
| 2025 | $3,778 | $131,840 | $20,000 | $111,840 |
| 2024 | $3,458 | $124,040 | $20,000 | $104,040 |
| 2023 | $3,458 | $121,600 | $20,000 | $101,600 |
Source: Public Records
About The Lofts at 5300
Map
Nearby Homes
- 5300 Peachtree Rd Unit 3309
- 5300 Peachtree Rd Unit 3308
- 5300 Peachtree Rd Unit 2310
- 5300 Peachtree Rd Unit 3207
- 5300 Peachtree Rd Unit 3507
- 5300 Peachtree Rd Unit 1209
- 5300 Peachtree Rd Unit 2510
- 5300 Peachtree Rd Unit 1608
- 5300 Peachtree Rd Unit 2401
- 5300 Peachtree Rd Unit 4514
- 5300 Peachtree Rd Unit 2309
- 2142 Dowdell Dr
- 3400 Malone Dr Unit 105
- 5200 Peachtree Rd Unit 3415
- 5200 Peachtree Rd Unit 2101
- 2045 Atz Cove
- 2150 Bristol Cove
- 5434 Peachtree Rd Unit 109
- 3553 Vanet Rd
- 3635 Admiral Dr
- 5300 Peachtree Rd Unit 1308
- 5300 Peachtree Rd Unit 3308
- 5300 Peachtree Rd Unit 4608
- 5300 Peachtree Rd Unit 2209
- 5300 Peachtree Rd Unit 211`
- 5300 Peachtree Rd
- 5300 Peachtree Rd Unit 3307
- 5300 Peachtree Rd Unit 2503
- 5300 Peachtree Rd Unit 1102
- 5300 Peachtree Rd Unit 3212
- 5300 Peachtree Rd Unit 1211
- 5300 Peachtree Rd Unit 212
- 5300 Peachtree Rd Unit 2403
- 5300 Peachtree Rd Unit 310
- 5300 Peachtree Rd Unit 1509
- 5300 Peachtree Rd Unit 4307
- 5300 Peachtree Rd Unit 1609
- 5300 Peachtree Rd Unit 4405
- 5300 Peachtree Rd Unit 3104
- 5300 Peachtree Rd Unit 201
Your Personal Tour Guide
Ask me questions while you tour the home.