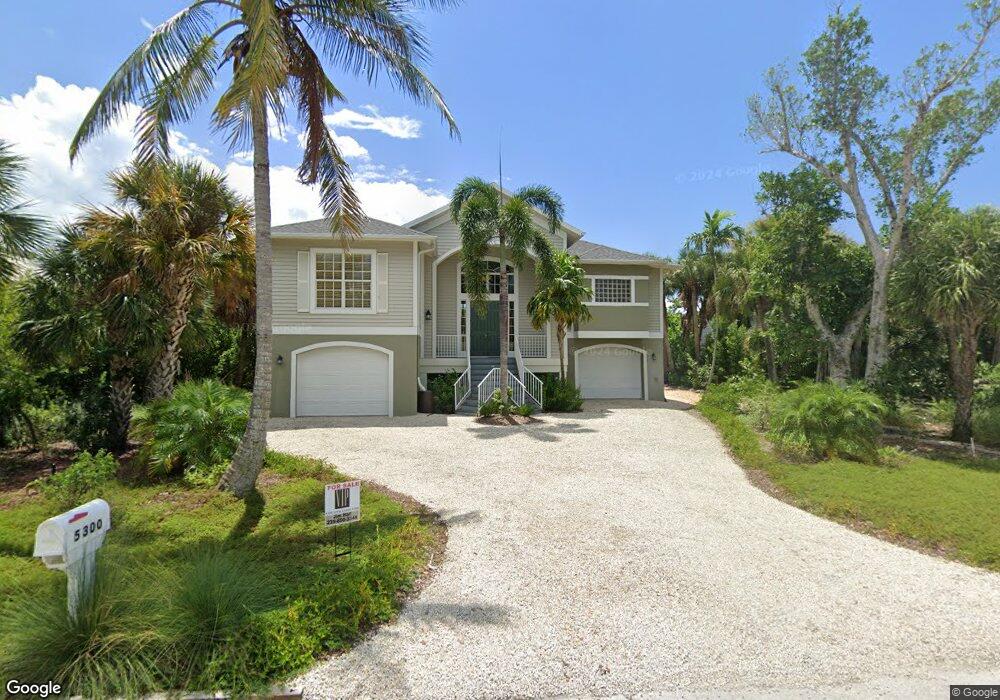
5300 Umbrella Pool Rd Unit 215 Sanibel, FL 33957
Estimated Value: $984,577 - $988,000
3
Beds
3
Baths
3,574
Sq Ft
$276/Sq Ft
Est. Value
About This Home
This home is located at 5300 Umbrella Pool Rd Unit 215, Sanibel, FL 33957 and is currently estimated at $985,644, approximately $275 per square foot. 5300 Umbrella Pool Rd Unit 215 is a home located in Lee County with nearby schools including Sanibel Elementary School, Cypress Lake Middle School, and Cypress Lake High School.
Ownership History
Date
Name
Owned For
Owner Type
Purchase Details
Closed on
Sep 4, 2025
Sold by
Robin C Humphrey Trust and Humphrey Robin C
Bought by
Jerry Redington Revocable Trust and Redington
Current Estimated Value
Purchase Details
Closed on
Aug 12, 2021
Sold by
Costello Linda S and Costello Michael J
Bought by
Humphrey Robin C and Robin C Humphrey Trust
Purchase Details
Closed on
Jun 4, 2007
Sold by
Costello Michael J and Costello Linda S
Bought by
Costello Linda S and Linda S Costello Trust
Purchase Details
Closed on
Feb 8, 2007
Sold by
Costello Michael J and Costello Linda S
Bought by
Costello Michael J and Costello Linda S
Purchase Details
Closed on
Mar 30, 2004
Sold by
Sailer Edward
Bought by
Costello Michael J and Costello Linda S
Purchase Details
Closed on
Feb 21, 1997
Sold by
Sailer Edward and Sailer Joan E
Bought by
Sailer Edward
Create a Home Valuation Report for This Property
The Home Valuation Report is an in-depth analysis detailing your home's value as well as a comparison with similar homes in the area
Home Values in the Area
Average Home Value in this Area
Purchase History
| Date | Buyer | Sale Price | Title Company |
|---|---|---|---|
| Jerry Redington Revocable Trust | $950,000 | None Listed On Document | |
| Humphrey Robin C | $1,190,000 | Title Group Services | |
| Costello Linda S | $148,300 | None Available | |
| Costello Michael J | $99,200 | None Available | |
| Costello Michael J | $340,000 | Guardian Title Services Corp | |
| Sailer Edward | -- | -- |
Source: Public Records
Tax History Compared to Growth
Tax History
| Year | Tax Paid | Tax Assessment Tax Assessment Total Assessment is a certain percentage of the fair market value that is determined by local assessors to be the total taxable value of land and additions on the property. | Land | Improvement |
|---|---|---|---|---|
| 2025 | $9,939 | $1,031,714 | $317,161 | $642,881 |
| 2024 | $9,939 | $705,617 | $428,102 | $251,363 |
| 2023 | $12,634 | $891,510 | $0 | $0 |
| 2022 | $11,729 | $865,575 | $0 | $0 |
| 2021 | $9,181 | $716,796 | $241,200 | $475,596 |
| 2020 | $9,622 | $645,310 | $0 | $0 |
| 2019 | $9,463 | $630,802 | $0 | $0 |
| 2018 | $9,469 | $619,040 | $0 | $0 |
| 2017 | $9,471 | $606,308 | $0 | $0 |
| 2016 | $9,431 | $651,520 | $167,800 | $483,720 |
| 2015 | $9,597 | $638,788 | $197,400 | $441,388 |
| 2014 | -- | $593,090 | $197,400 | $395,690 |
| 2013 | -- | $613,628 | $202,300 | $411,328 |
Source: Public Records
Map
Nearby Homes
- 5309 Umbrella Pool Rd
- 0 Bowmans Beach Rd Unit 2250263
- 1769 Bowmans Beach Rd
- 5117 Sea Bell Rd Unit G102
- 5117 Sea Bell Rd Unit B109
- 5117 Sea Bell Rd Unit E109
- 5117 Sea Bell Rd Unit B101
- 5117 Sea Bell Rd Unit A203
- 5117 Sea Bell Rd Unit C207
- 5117 Sea Bell Rd Unit F104
- 5117 Sea Bell Rd Unit G206
- 5117 Sea Bell Rd Unit F111
- 1973 Wild Lime Dr
- 1986 Wild Lime Dr
- 4631 Bowen Bayou Rd
- 4560 Brainard Bayou Rd
- 1990 My Tern Ct
- 5298 Umbrella Pool Rd
- 5302 Umbrella Pool Rd
- 5299 Umbrella Pool Rd
- 5296 Umbrella Pool Rd
- 5304 Umbrella Pool Rd
- 5303 Umbrella Pool Rd
- 5297 Umbrella Pool Rd
- 5294 Umbrella Pool Rd
- 5305 Umbrella Pool Rd
- 5306 Umbrella Pool Rd
- 5302 Ladyfinger Lake Rd
- 5293 Umbrella Pool Rd
- 5304 Ladyfinger Lake Rd
- 1834 Long Point Ln
- 5292 Umbrella Pool Rd
- 1838 Long Point Ln
- 5306 Ladyfinger Lake Rd
- 5307 Umbrella Pool Rd
- 5307 Umbrella Pool Rd Unit 208
- 5284 Ladyfinger Lake Rd