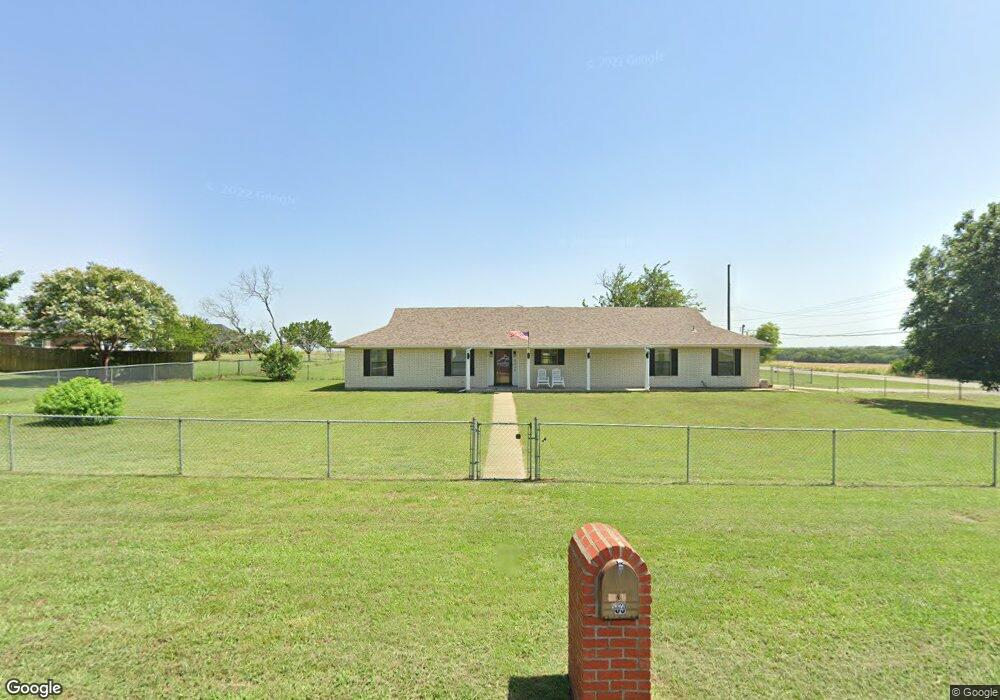
5300 W Meadowridge Rd Sherman, TX 75092
Estimated Value: $246,000 - $281,000
--
Bed
--
Bath
1,159
Sq Ft
$231/Sq Ft
Est. Value
About This Home
This home is located at 5300 W Meadowridge Rd, Sherman, TX 75092 and is currently estimated at $267,490, approximately $230 per square foot. 5300 W Meadowridge Rd is a home located in Grayson County with nearby schools including Henry W. Sory Elementary School, Piner Middle School, and Dillingham Intermediate School.
Ownership History
Date
Name
Owned For
Owner Type
Purchase Details
Closed on
Mar 28, 2024
Sold by
Petrean Andra and Lansford Obie
Bought by
Fuquay Kevin
Current Estimated Value
Home Financials for this Owner
Home Financials are based on the most recent Mortgage that was taken out on this home.
Original Mortgage
$300,000
Outstanding Balance
$295,423
Interest Rate
6.77%
Mortgage Type
VA
Estimated Equity
-$27,933
Purchase Details
Closed on
Aug 16, 2019
Sold by
Lansford Gary L and Lansford Kathy L
Bought by
Petrean Andra and Lansford Obie
Home Financials for this Owner
Home Financials are based on the most recent Mortgage that was taken out on this home.
Original Mortgage
$112,500
Interest Rate
3.7%
Mortgage Type
New Conventional
Purchase Details
Closed on
Sep 15, 2006
Sold by
Savage Bill L and Savage Laquita
Bought by
Lansford Gary L and Lansford Kathy L
Purchase Details
Closed on
Sep 7, 2005
Sold by
Green James M and Green Cristal M
Bought by
Savage Bill L and Savage Laquita J
Create a Home Valuation Report for This Property
The Home Valuation Report is an in-depth analysis detailing your home's value as well as a comparison with similar homes in the area
Home Values in the Area
Average Home Value in this Area
Purchase History
| Date | Buyer | Sale Price | Title Company |
|---|---|---|---|
| Fuquay Kevin | -- | None Listed On Document | |
| Petrean Andra | -- | Red River Title Co | |
| Lansford Gary L | -- | None Available | |
| Savage Bill L | -- | -- |
Source: Public Records
Mortgage History
| Date | Status | Borrower | Loan Amount |
|---|---|---|---|
| Open | Fuquay Kevin | $300,000 | |
| Previous Owner | Petrean Andra | $112,500 |
Source: Public Records
Tax History Compared to Growth
Tax History
| Year | Tax Paid | Tax Assessment Tax Assessment Total Assessment is a certain percentage of the fair market value that is determined by local assessors to be the total taxable value of land and additions on the property. | Land | Improvement |
|---|---|---|---|---|
| 2025 | $5,119 | $250,934 | $119,340 | $131,594 |
| 2024 | $6,191 | $282,284 | $123,930 | $158,354 |
| 2023 | $5,853 | $266,585 | $106,335 | $160,250 |
| 2022 | $4,737 | $202,123 | $52,785 | $149,338 |
| 2021 | $3,977 | $158,677 | $57,758 | $100,919 |
| 2020 | $3,737 | $142,403 | $48,960 | $93,443 |
| 2019 | $2,940 | $129,215 | $37,522 | $91,693 |
| 2018 | $2,487 | $122,153 | $37,522 | $84,631 |
| 2017 | $2,244 | $90,133 | $10,537 | $79,596 |
| 2016 | $2,166 | $86,997 | $10,537 | $76,460 |
| 2015 | $1,748 | $88,328 | $6,480 | $81,848 |
| 2014 | $1,886 | $88,077 | $6,480 | $81,597 |
Source: Public Records
Map
Nearby Homes
- 2615 Rolling Hills Dr
- 6514 Joyce Ln
- 586 Pleasant Home Rd
- 1401 Cimmaron Trail
- 1404 Tejas Dr
- 1426 S Raven Dr
- 1407 Swan Ridge Dr
- 6935 S Farm To Market Road 1417
- 4501 Hawk Ln
- 4507 Falcon Dr
- 1415 Mallard Dr
- 2134 Peggeys Cove
- 1412 Ascot Ave
- 3508 Ballam St
- 3302 Hanan St
- 2401 Southridge Ln
- 1612 Heritage Creek Dr
- 1604 Heritage Creek Dr
- 4024 Belmont Blvd
- 3312 Sherbrooke Place
- 5212 W Meadowridge Rd
- 5320 W Meadowridge Rd
- 5303 W Meadowridge Rd
- 5315 W Meadowridge Rd
- 5208 W Meadowridge Rd
- 5211 W Meadowridge Rd
- 5303 Calle Dr
- 5207 W Meadowridge Rd
- 5311 Calle Dr
- 5207 Calle Dr
- 5306 Calle Dr
- 5200 W Meadowridge Rd
- 5201 W Meadowridge Rd
- 5314 Calle Dr
- 5300 Trailridge Rd
- 5214 Trailridge Rd
- 5312 Trailridge Rd
- 5208 Calle Dr
- 2805 Bella Dr
- 2600 S Westridge Trail