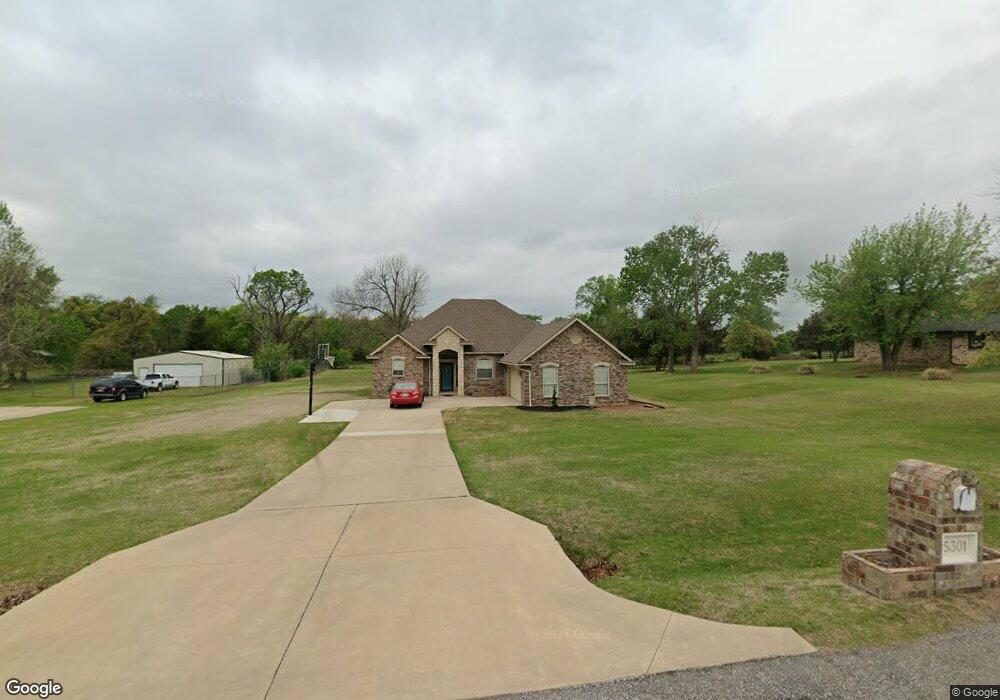
5301 Hart Ln Choctaw, OK 73020
Estimated Value: $304,715 - $361,000
3
Beds
2
Baths
2,043
Sq Ft
$164/Sq Ft
Est. Value
About This Home
This home is located at 5301 Hart Ln, Choctaw, OK 73020 and is currently estimated at $335,929, approximately $164 per square foot. 5301 Hart Ln is a home located in Oklahoma County with nearby schools including Jones Elementary School, Jones Middle School, and Jones High School.
Ownership History
Date
Name
Owned For
Owner Type
Purchase Details
Closed on
Apr 30, 2008
Sold by
Collins Brian W and Collins Amy K
Bought by
Berry Michael W and Berry Kathleen C
Current Estimated Value
Home Financials for this Owner
Home Financials are based on the most recent Mortgage that was taken out on this home.
Original Mortgage
$156,750
Outstanding Balance
$99,321
Interest Rate
5.89%
Mortgage Type
Purchase Money Mortgage
Estimated Equity
$236,608
Purchase Details
Closed on
Aug 17, 2005
Sold by
Maples Tom and Maples Jill R
Bought by
Collins Brian W and Collins Amy K
Home Financials for this Owner
Home Financials are based on the most recent Mortgage that was taken out on this home.
Original Mortgage
$153,884
Interest Rate
5.81%
Mortgage Type
FHA
Purchase Details
Closed on
Dec 16, 2004
Sold by
Masoner James C and Masoner April L
Bought by
Maples Tom and Maples Jill R
Home Financials for this Owner
Home Financials are based on the most recent Mortgage that was taken out on this home.
Original Mortgage
$150,000
Interest Rate
5.78%
Mortgage Type
Purchase Money Mortgage
Create a Home Valuation Report for This Property
The Home Valuation Report is an in-depth analysis detailing your home's value as well as a comparison with similar homes in the area
Home Values in the Area
Average Home Value in this Area
Purchase History
| Date | Buyer | Sale Price | Title Company |
|---|---|---|---|
| Berry Michael W | $169,000 | Capitol Abstract & Title Co | |
| Collins Brian W | $150,000 | Stewart Escrow & Title Midwe | |
| Maples Tom | $15,000 | Stewart Escrow & Title Midwe |
Source: Public Records
Mortgage History
| Date | Status | Borrower | Loan Amount |
|---|---|---|---|
| Open | Berry Michael W | $156,750 | |
| Previous Owner | Collins Brian W | $153,884 | |
| Previous Owner | Maples Tom | $150,000 |
Source: Public Records
Tax History Compared to Growth
Tax History
| Year | Tax Paid | Tax Assessment Tax Assessment Total Assessment is a certain percentage of the fair market value that is determined by local assessors to be the total taxable value of land and additions on the property. | Land | Improvement |
|---|---|---|---|---|
| 2024 | $2,441 | $23,352 | $5,778 | $17,574 |
| 2023 | $2,441 | $22,671 | $5,352 | $17,319 |
| 2022 | $2,289 | $22,011 | $5,117 | $16,894 |
| 2021 | $2,266 | $21,370 | $4,792 | $16,578 |
| 2020 | $2,208 | $20,748 | $4,463 | $16,285 |
| 2019 | $2,208 | $20,144 | $4,163 | $15,981 |
| 2018 | $2,157 | $19,557 | $0 | $0 |
| 2017 | $2,075 | $18,987 | $3,287 | $15,700 |
| 2016 | $2,020 | $18,434 | $3,217 | $15,217 |
| 2015 | $1,869 | $17,897 | $3,552 | $14,345 |
| 2014 | $2,022 | $19,012 | $3,552 | $15,460 |
Source: Public Records
Map
Nearby Homes
- 6485 Fawn Ridge
- 0 Carver Ave Unit 1169077
- 14040 NE 63rd St
- 4708 Richardson Ave
- 6001 Sandyhill Rd
- 5213 Lacue St
- 0 NE 36th St
- 0 Randal Dr
- 12608 Nelson Ave
- 0 Nelson Ave
- 5928 Randal Dr
- 12712 NE 38th St
- 12509 NE 36th St
- 12724 Parker Heights Blvd
- 3460 N Ridge Dr
- 14117 N Ridge Dr
- 14248 N Ridge Dr
- 14028 N Ridge Dr
- 14029 N Ridge Dr
- 12704 NE 37th St