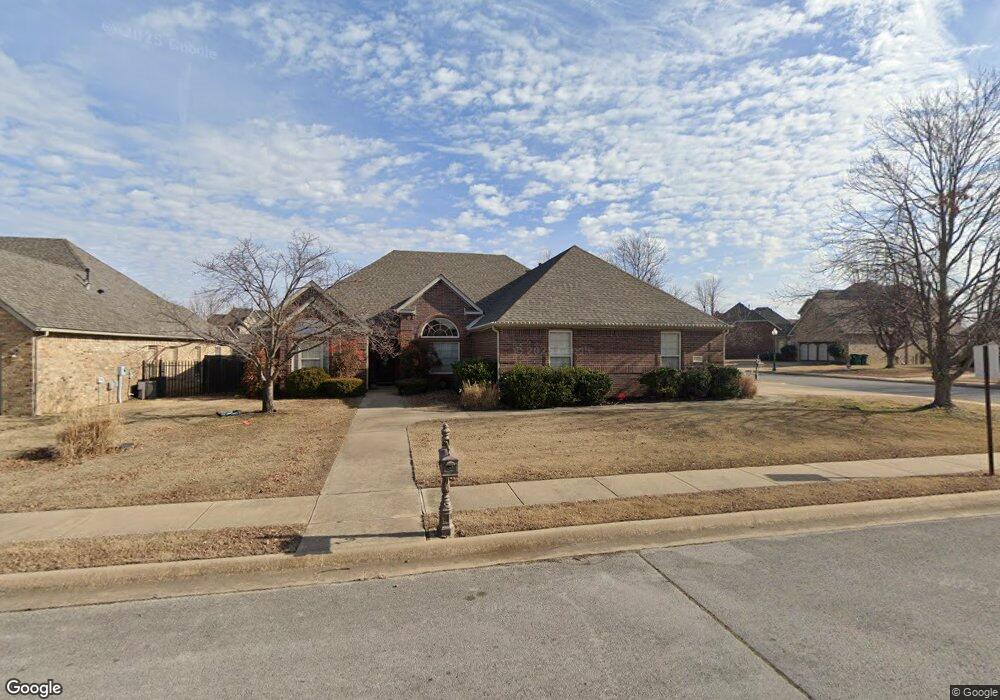
5301 Stone Bay Ct Rogers, AR 72758
Estimated Value: $505,000 - $527,000
4
Beds
3
Baths
2,230
Sq Ft
$231/Sq Ft
Est. Value
About This Home
This home is located at 5301 Stone Bay Ct, Rogers, AR 72758 and is currently estimated at $515,344, approximately $231 per square foot. 5301 Stone Bay Ct is a home located in Benton County with nearby schools including Bright Field Middle School, Fulbright Junior High School, and Bentonville High School.
Ownership History
Date
Name
Owned For
Owner Type
Purchase Details
Closed on
Dec 28, 2017
Sold by
Lee Bradley E and Lee Rebecca A
Bought by
Lee Phil and Lee Christina
Current Estimated Value
Home Financials for this Owner
Home Financials are based on the most recent Mortgage that was taken out on this home.
Original Mortgage
$350,000
Outstanding Balance
$294,746
Interest Rate
3.95%
Mortgage Type
New Conventional
Estimated Equity
$220,599
Purchase Details
Closed on
Oct 24, 2017
Sold by
Davis Darren Ryel and Davis Dorry Lea
Bought by
Lowe Ralen
Purchase Details
Closed on
May 22, 2009
Sold by
Hopkins Steven M and Hopkins Annie M
Bought by
Davis Darren Ryel and Davis Dorry Lea
Home Financials for this Owner
Home Financials are based on the most recent Mortgage that was taken out on this home.
Original Mortgage
$233,923
Interest Rate
4.72%
Mortgage Type
VA
Create a Home Valuation Report for This Property
The Home Valuation Report is an in-depth analysis detailing your home's value as well as a comparison with similar homes in the area
Home Values in the Area
Average Home Value in this Area
Purchase History
| Date | Buyer | Sale Price | Title Company |
|---|---|---|---|
| Lee Phil | -- | None Available | |
| Lowe Ralen | $240,000 | Realty Title & Closing Servi | |
| Davis Darren Ryel | $229,000 | Elite Title Company Inc |
Source: Public Records
Mortgage History
| Date | Status | Borrower | Loan Amount |
|---|---|---|---|
| Open | Lee Phil | $350,000 | |
| Previous Owner | Davis Darren Ryel | $233,923 |
Source: Public Records
Tax History Compared to Growth
Tax History
| Year | Tax Paid | Tax Assessment Tax Assessment Total Assessment is a certain percentage of the fair market value that is determined by local assessors to be the total taxable value of land and additions on the property. | Land | Improvement |
|---|---|---|---|---|
| 2025 | $4,357 | $92,817 | $20,000 | $72,817 |
| 2024 | $4,107 | $92,817 | $20,000 | $72,817 |
| 2023 | $3,733 | $61,100 | $15,000 | $46,100 |
| 2022 | $3,519 | $61,100 | $15,000 | $46,100 |
| 2021 | $3,219 | $61,100 | $15,000 | $46,100 |
| 2020 | $2,952 | $48,000 | $12,800 | $35,200 |
| 2019 | $2,952 | $48,000 | $12,800 | $35,200 |
| 2018 | $2,952 | $48,000 | $12,800 | $35,200 |
| 2017 | $2,448 | $52,260 | $12,800 | $39,460 |
| 2016 | $2,448 | $52,260 | $12,800 | $39,460 |
| 2015 | $2,709 | $44,340 | $7,400 | $36,940 |
| 2014 | $2,359 | $44,340 | $7,400 | $36,940 |
Source: Public Records
Map
Nearby Homes
- 5309 Stone Bay Ct
- 6515 W Pleasant Way
- 5106 S Sloan Cir
- 6515 Alyssa Ln
- 6603 Atherton Ct
- 6115 W Laurel Hill Ln
- 6219 W Southgate Ct
- 5093 S Strathmore Station Dr
- 5402 S Turnberry Rd
- 6108 Pleasant Dr
- 6104 Laurel Hill Ln
- 6002 Bainbridge Dr
- 5206 S 60th Place
- 5412 Braebourne Rd
- 6503 W Hearth Bay
- 5213 S 60th Place
- 3 S Fiddlesticks Trail
- 1802 S Liberty Bell Rd
- 6815 W Shadow Valley Rd
- 6105 W West Dr
- 5301 S Stone Bay Ct
- 5303 Stone Bay Ct
- 6403 W Bridge Bay Dr
- 6403 Bridge Bay Ln
- 6400 Bridge Bay Ln
- 5305 Stone Bay Ct
- 6400 W Bridge Bay Dr
- 5300 S Stone Bay Ct
- 5300 Stone Bay Ct
- 6402 Bridge Bay Ln
- 6402 W Bridge Bay Dr
- 6405 Bridge Bay Ln
- 6404 Bridge Bay Ln
- 6404 W Bridge Bay Dr
- 6500 Hearthstone Dr
- 5307 Stone Bay Ct
- 6407 Bridge Bay Ln
- 6407 W Bridge Bay Dr
- 5308 Stone Bay Ct