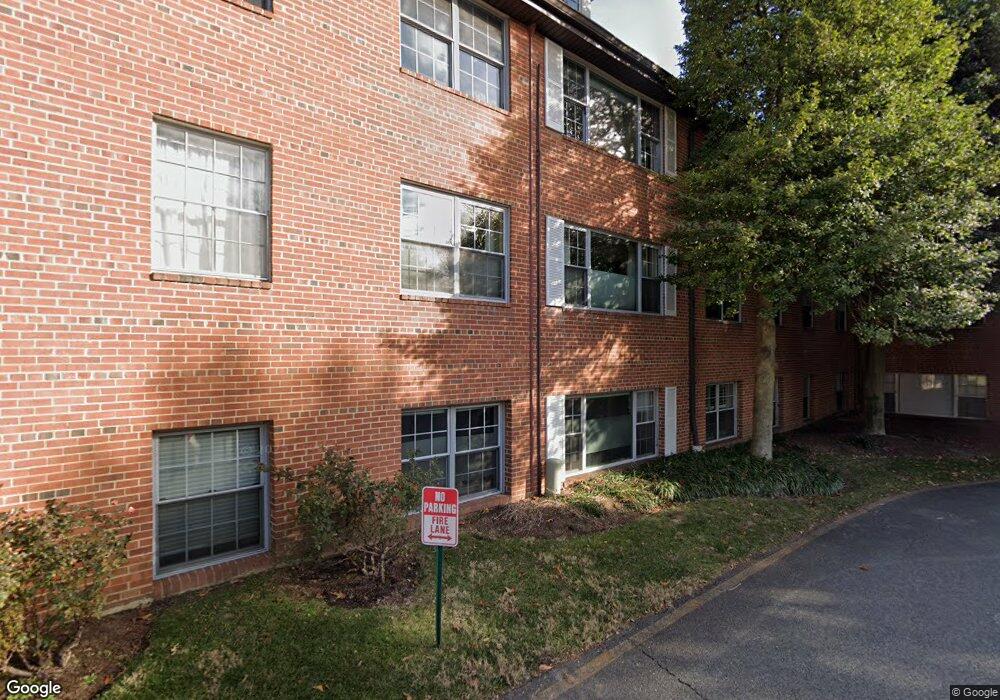
Kenwood Place 5301 Westbard Cir Unit 340 Bethesda, MD 20816
Westwood NeighborhoodEstimated Value: $473,000 - $606,000
3
Beds
2
Baths
1,711
Sq Ft
$306/Sq Ft
Est. Value
About This Home
This home is located at 5301 Westbard Cir Unit 340, Bethesda, MD 20816 and is currently estimated at $523,761, approximately $306 per square foot. 5301 Westbard Cir Unit 340 is a home located in Montgomery County with nearby schools including Wood Acres Elementary School, Marion Elementary School, and Thomas W. Pyle Middle School.
Ownership History
Date
Name
Owned For
Owner Type
Purchase Details
Closed on
Apr 12, 2021
Sold by
Pathirana Wijentunga P and Pathirana Gamachchi D
Bought by
Pathirana Gamachchi P D Dilani and Pathirana Gamachchi P
Current Estimated Value
Home Financials for this Owner
Home Financials are based on the most recent Mortgage that was taken out on this home.
Original Mortgage
$320,000
Outstanding Balance
$288,921
Interest Rate
3%
Mortgage Type
New Conventional
Estimated Equity
$234,840
Purchase Details
Closed on
Apr 21, 2009
Sold by
Odonnell Joan M
Bought by
Pathirana Wijentunga
Purchase Details
Closed on
Dec 26, 1996
Sold by
Bakst Sharon K
Bought by
Odonnell Joan M
Purchase Details
Closed on
Oct 22, 1996
Sold by
Peabody Mary O
Bought by
Sharon K Bakst
Create a Home Valuation Report for This Property
The Home Valuation Report is an in-depth analysis detailing your home's value as well as a comparison with similar homes in the area
Home Values in the Area
Average Home Value in this Area
Purchase History
| Date | Buyer | Sale Price | Title Company |
|---|---|---|---|
| Pathirana Gamachchi P D Dilani | -- | Closeline Settlements | |
| Pathirana Wijentunga | $320,000 | -- | |
| Odonnell Joan M | $110,000 | -- | |
| Sharon K Bakst | -- | -- |
Source: Public Records
Mortgage History
| Date | Status | Borrower | Loan Amount |
|---|---|---|---|
| Open | Pathirana Gamachchi P D Dilani | $320,000 |
Source: Public Records
Tax History Compared to Growth
Tax History
| Year | Tax Paid | Tax Assessment Tax Assessment Total Assessment is a certain percentage of the fair market value that is determined by local assessors to be the total taxable value of land and additions on the property. | Land | Improvement |
|---|---|---|---|---|
| 2025 | $5,407 | $465,000 | $139,500 | $325,500 |
| 2024 | $5,407 | $461,667 | $0 | $0 |
| 2023 | $4,675 | $458,333 | $0 | $0 |
| 2022 | $3,667 | $455,000 | $136,500 | $318,500 |
| 2021 | $4,351 | $450,000 | $0 | $0 |
| 2020 | $8,589 | $445,000 | $0 | $0 |
| 2019 | $4,235 | $440,000 | $132,000 | $308,000 |
| 2018 | $3,986 | $416,667 | $0 | $0 |
| 2017 | $3,634 | $393,333 | $0 | $0 |
| 2016 | $2,792 | $370,000 | $0 | $0 |
| 2015 | $2,792 | $353,333 | $0 | $0 |
| 2014 | $2,792 | $336,667 | $0 | $0 |
Source: Public Records
About Kenwood Place
Map
Nearby Homes
- 5348 Zenith Overlook
- 5420 Goshawk Aly
- Citrine Plan at Westbard Square - The Brownstones
- Lapis Plan at Westbard Square - The Brownstones
- Citrine with Elevator Plan at Westbard Square - The Brownstones
- Beryl Plan at Westbard Square - The Brownstones
- 5117 Willet Bridge Rd
- 5311 Allandale Rd
- 5101 River Rd
- 5101 River Rd
- 5101 River Rd
- 5101 River Rd
- 5101 River Rd
- 5900 Kennedy Dr
- 5612 Namakagan Rd
- 5715 Massachusetts Ave
- 5100 Dorset Ave Unit 111
- 4911 Falstone Ave
- 5116 Lawton Dr
- 5011 Baltimore Ave
- 5301 Westbard Cir Unit 325
- 5301 Westbard Cir Unit 218
- 5301 Westbard Cir Unit 244
- 5301 Westbard Cir Unit 331
- 5301 Westbard Cir Unit 234
- 5301 Westbard Cir Unit 313
- 5301 Westbard Cir Unit 226
- 5301 Westbard Cir Unit 239
- 5301 Westbard Cir Unit 429
- 5301 Westbard Cir Unit 6
- 5301 Westbard Cir Unit 320
- 5301 Westbard Cir Unit 410
- 5301 Westbard Cir Unit 5
- 5301 Westbard Cir Unit 109
- 5301 Westbard Cir Unit 308
- 5301 Westbard Cir Unit 4
- 5301 Westbard Cir Unit 406
- 5301 Westbard Cir Unit 426
- 5301 Westbard Cir Unit 304
- 5301 Westbard Cir Unit 419