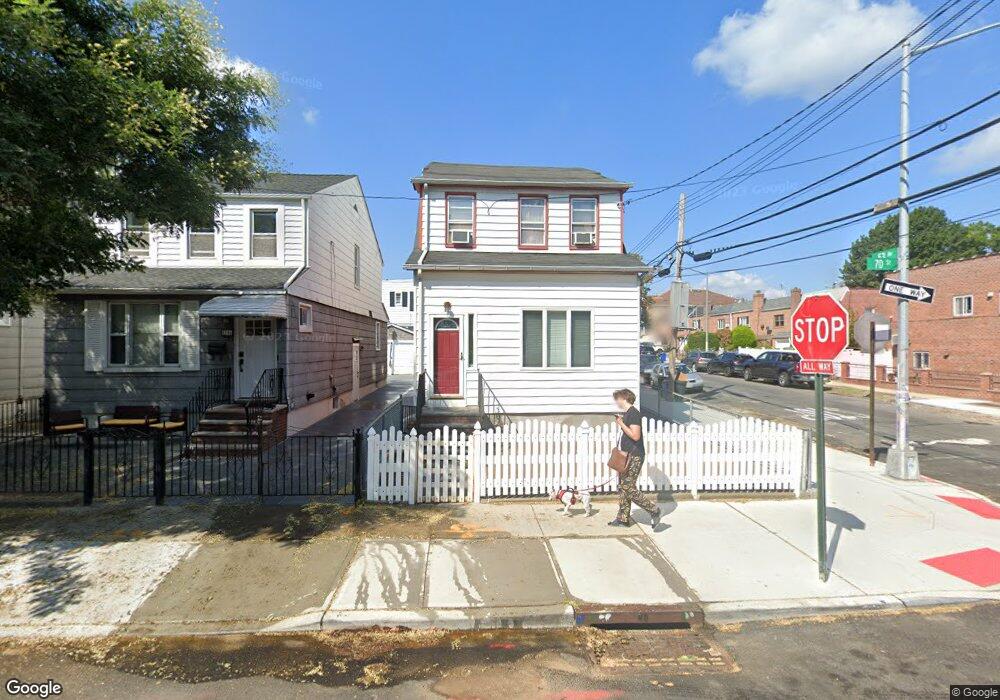
5302 70th St Maspeth, NY 11378
Maspeth NeighborhoodEstimated Value: $895,872 - $1,137,000
Studio
--
Bath
1,440
Sq Ft
$706/Sq Ft
Est. Value
About This Home
This home is located at 5302 70th St, Maspeth, NY 11378 and is currently estimated at $1,016,968, approximately $706 per square foot. 5302 70th St is a home located in Queens County with nearby schools including Ps 58 School Of Heroes, IS 73 - The Frank Sansivieri School, and Grover Cleveland High School.
Ownership History
Date
Name
Owned For
Owner Type
Purchase Details
Closed on
Mar 27, 1999
Sold by
Goodman James J
Bought by
Goodman James J and Goodman Mary Maloney
Current Estimated Value
Home Financials for this Owner
Home Financials are based on the most recent Mortgage that was taken out on this home.
Original Mortgage
$105,000
Interest Rate
6.85%
Create a Home Valuation Report for This Property
The Home Valuation Report is an in-depth analysis detailing your home's value as well as a comparison with similar homes in the area
Home Values in the Area
Average Home Value in this Area
Purchase History
| Date | Buyer | Sale Price | Title Company |
|---|---|---|---|
| Goodman James J | -- | First American Title Ins Co | |
| Goodman James J | -- | First American Title Ins Co |
Source: Public Records
Mortgage History
| Date | Status | Borrower | Loan Amount |
|---|---|---|---|
| Closed | Goodman James J | $105,000 |
Source: Public Records
Tax History Compared to Growth
Tax History
| Year | Tax Paid | Tax Assessment Tax Assessment Total Assessment is a certain percentage of the fair market value that is determined by local assessors to be the total taxable value of land and additions on the property. | Land | Improvement |
|---|---|---|---|---|
| 2025 | $7,456 | $39,349 | $9,215 | $30,134 |
| 2024 | $7,456 | $37,123 | $8,785 | $28,338 |
| 2023 | $7,034 | $35,023 | $8,376 | $26,647 |
| 2022 | $6,596 | $49,260 | $13,560 | $35,700 |
| 2021 | $6,954 | $52,680 | $13,560 | $39,120 |
| 2020 | $6,941 | $47,280 | $13,560 | $33,720 |
| 2019 | $6,472 | $47,760 | $13,560 | $34,200 |
| 2018 | $5,950 | $29,186 | $10,760 | $18,426 |
| 2017 | $5,613 | $27,536 | $8,967 | $18,569 |
| 2016 | $5,505 | $27,536 | $8,967 | $18,569 |
| 2015 | $2,913 | $27,326 | $13,690 | $13,636 |
| 2014 | $2,913 | $25,780 | $12,565 | $13,215 |
Source: Public Records
Map
Nearby Homes