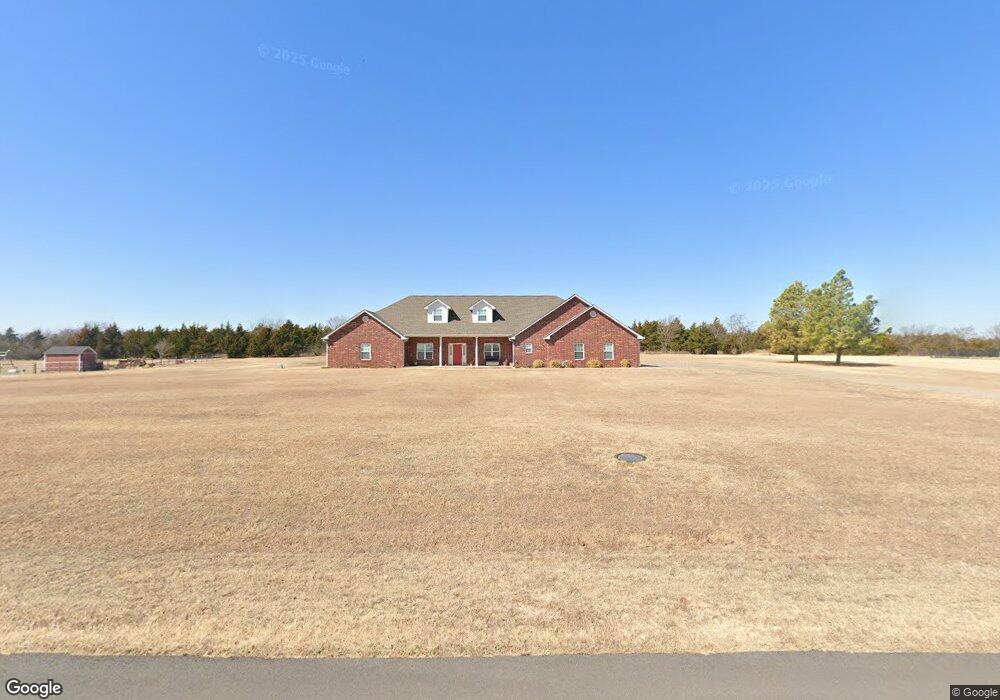
5302 N Hunters Ridge Stillwater, OK 74075
Estimated Value: $477,000 - $661,000
4
Beds
3
Baths
3,169
Sq Ft
$177/Sq Ft
Est. Value
About This Home
This home is located at 5302 N Hunters Ridge, Stillwater, OK 74075 and is currently estimated at $562,427, approximately $177 per square foot. 5302 N Hunters Ridge is a home located in Payne County with nearby schools including Richmond Elementary School, Stillwater Junior High School, and Stillwater Middle School.
Ownership History
Date
Name
Owned For
Owner Type
Purchase Details
Closed on
Dec 20, 2023
Sold by
Mcsperitt Kenneth E and Mcsperitt Marilyn J
Bought by
Mcsperitt Family Trust and Mcsperitt
Current Estimated Value
Purchase Details
Closed on
May 13, 2022
Sold by
Nicholas Family Revocable Trust
Bought by
308 Yellowrock Llc
Purchase Details
Closed on
May 20, 2008
Sold by
Boyd George E and Boyd George
Bought by
Mcsperitt Kenenth E and Mcsperitt Marilyn J
Purchase Details
Closed on
Dec 4, 2006
Sold by
Sattari Mehdi and Boyd Christine E
Bought by
Boyd George E
Purchase Details
Closed on
Nov 27, 2006
Sold by
Gosz Russell and Gosz Heather E
Bought by
Boyd George E
Purchase Details
Closed on
Nov 17, 2006
Sold by
Boyd Ryan M and Boyd Amber
Bought by
Boyd George E
Purchase Details
Closed on
Nov 14, 2006
Sold by
Boyd Joel E and Boyd Kerri
Bought by
Boyd George E
Create a Home Valuation Report for This Property
The Home Valuation Report is an in-depth analysis detailing your home's value as well as a comparison with similar homes in the area
Home Values in the Area
Average Home Value in this Area
Purchase History
| Date | Buyer | Sale Price | Title Company |
|---|---|---|---|
| Mcsperitt Family Trust | -- | None Listed On Document | |
| 308 Yellowrock Llc | -- | None Listed On Document | |
| Nicholas Family Revocable Trust | -- | None Listed On Document | |
| Mcsperitt Kenenth E | $60,000 | Community Escrow & Title Co | |
| Boyd George E | -- | None Available | |
| Boyd George E | -- | None Available | |
| Boyd George E | -- | None Available | |
| Boyd George E | -- | None Available |
Source: Public Records
Tax History Compared to Growth
Tax History
| Year | Tax Paid | Tax Assessment Tax Assessment Total Assessment is a certain percentage of the fair market value that is determined by local assessors to be the total taxable value of land and additions on the property. | Land | Improvement |
|---|---|---|---|---|
| 2024 | $4,438 | $44,645 | $5,345 | $39,300 |
| 2023 | $4,438 | $43,345 | $5,458 | $37,887 |
| 2022 | $4,159 | $42,083 | $5,771 | $36,312 |
| 2021 | $3,953 | $40,857 | $6,119 | $34,738 |
| 2020 | $3,835 | $39,667 | $6,514 | $33,153 |
| 2019 | $3,800 | $38,512 | $6,324 | $32,188 |
| 2018 | $3,682 | $37,391 | $6,496 | $30,895 |
| 2017 | $3,566 | $36,301 | $5,682 | $30,619 |
| 2016 | $3,533 | $35,244 | $5,283 | $29,961 |
| 2015 | $3,475 | $34,218 | $4,896 | $29,322 |
| 2014 | $3,400 | $33,222 | $4,520 | $28,702 |
Source: Public Records
Map
Nearby Homes
- 1116 W Stonecrest Ave
- 1321 W Falls Dr
- 5808 Chateau Place
- 4700 N Washington St
- 4703 N Washington St
- 6718 N Seadog Rd
- 0000 N Washington St
- 823 Ranch Ave
- 5399 N Husband St Unit 5298 N. Perkins Rd
- 4816 N Rogers Dr
- 4810 N Rogers Dr
- 122 E Richmond Rd
- 4803 N Rogers Dr
- 106 W Burris Rd
- 4628 N Rogers Dr
- 00 Glencoe Oaks Range Rd
- TBD 20 Acres Range Rd
- 104 E Rogers Ct
- 108 E Rogers Ct
- London - Canvas Collection Plan at The Canyons
- 5318 N Hunters Ridge
- 5224 N Hunters Ridge
- 5307 N Hunters Ridge
- 5225 N Hunters Ridge
- 5414 N Hunters Ridge
- 5212 N Hunters Ridge
- 5405 N Hunters Ridge
- 5504 N Hunters Ridge
- 5206 N Hunters Ridge
- 5423 N Hunters Ridge
- 5201 N Hunters Ridge
- 5510 N Hunters Ridge
- 5124 N Hunters Ridge
- 5515 N Hunters Ridge
- 5522 N Hunters Ridge
- 5111 N Hunters Ridge
- 1514 W Richmond Rd
- 5102 N Hunters Ridge
- 5601 N Hunters Ridge
- 5606 N Hunters Ridge