5302 Thunderbird Trail Granbury, TX 76049
Estimated Value: $410,790 - $528,000
--
Bed
--
Bath
2,971
Sq Ft
$156/Sq Ft
Est. Value
About This Home
This home is located at 5302 Thunderbird Trail, Granbury, TX 76049 and is currently estimated at $464,698, approximately $156 per square foot. 5302 Thunderbird Trail is a home located in Hood County with nearby schools including Acton Elementary School, Acton Middle School, and Granbury High School.
Ownership History
Date
Name
Owned For
Owner Type
Purchase Details
Closed on
Nov 1, 2021
Sold by
Jeffrey Travis John
Bought by
Jeffrey Kimberly E
Current Estimated Value
Purchase Details
Closed on
Jun 1, 2021
Sold by
Strickland Diane L and Strickland Jeffrey Kimberly
Bought by
Jeffrey Kimberly E and Jeffrey Travis John
Purchase Details
Closed on
May 1, 1996
Sold by
Strickland Charles H and Strickland Diane L
Bought by
Strickland Charles H and Strickland Diane L
Purchase Details
Closed on
Mar 30, 1994
Sold by
Kilpatrick Kilpatrick J and Kilpatrick Beverly
Bought by
Strickland Charles H and Strickland Diane L
Purchase Details
Closed on
Dec 20, 1993
Sold by
Thomason C M Estate
Bought by
Strickland Charles H and Strickland Diane L
Purchase Details
Closed on
Jan 20, 1975
Sold by
Black Oscar L
Bought by
Strickland Charles H and Strickland Diane L
Create a Home Valuation Report for This Property
The Home Valuation Report is an in-depth analysis detailing your home's value as well as a comparison with similar homes in the area
Home Values in the Area
Average Home Value in this Area
Purchase History
| Date | Buyer | Sale Price | Title Company |
|---|---|---|---|
| Jeffrey Kimberly E | -- | None Available | |
| Jeffrey Kimberly E | -- | None Listed On Document | |
| Strickland Charles H | -- | -- | |
| Strickland Charles H | -- | -- | |
| Strickland Charles H | -- | -- | |
| Strickland Charles H | -- | -- |
Source: Public Records
Tax History Compared to Growth
Tax History
| Year | Tax Paid | Tax Assessment Tax Assessment Total Assessment is a certain percentage of the fair market value that is determined by local assessors to be the total taxable value of land and additions on the property. | Land | Improvement |
|---|---|---|---|---|
| 2025 | $3,872 | $416,560 | $40,000 | $376,560 |
| 2024 | $4,164 | $427,640 | $40,000 | $387,640 |
| 2023 | $5,338 | $438,710 | $40,000 | $398,710 |
| 2022 | $5,530 | $409,400 | $40,000 | $369,400 |
| 2021 | $5,140 | $322,240 | $20,000 | $302,240 |
| 2020 | $4,825 | $300,270 | $20,000 | $280,270 |
| 2019 | $4,623 | $270,240 | $20,000 | $250,240 |
| 2018 | $4,362 | $254,990 | $20,000 | $234,990 |
| 2017 | $4,230 | $240,730 | $20,000 | $220,730 |
| 2016 | $4,154 | $236,400 | $20,000 | $216,400 |
| 2015 | $3,554 | $217,620 | $20,000 | $197,620 |
| 2014 | $3,554 | $228,020 | $20,000 | $208,020 |
Source: Public Records
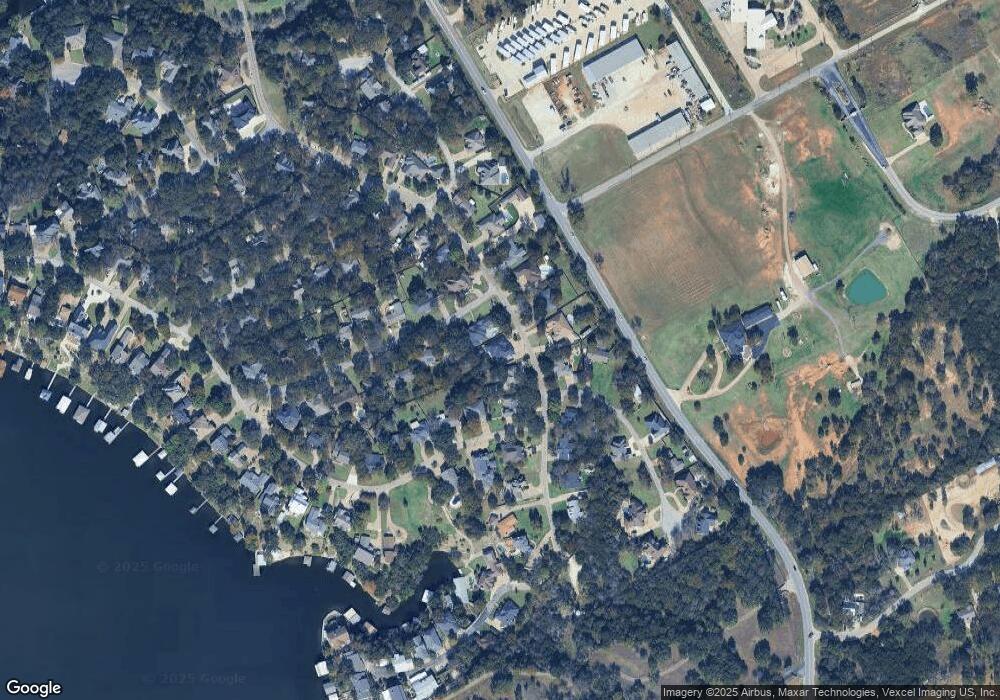
Map
Nearby Homes
- 6309 Sioux Dr
- 5309 Comanche Vista Trail
- 5202 Comanche Vista Trail
- 5400 Fall Creek Hwy
- 6500 Lusk Branch Ct
- 5010 Comanche Vista Ct
- 100 Helton
- 209 Martin Dr
- 225 Martin Dr
- 228 Martin Dr
- 5506 Cortez Dr
- 4000 Fairway Dr
- 300 Kenyon Ct
- 221 Maverick Ct
- 6101 W Choctaw Ct
- 337 Kenyon Ct
- 4115 Crescent Dr
- 5408 Cortez Dr
- 5710 Cortez Dr
- 4017 Fairway Dr
- 5304 Thunderbird Trail
- 6301 Sioux Dr
- 6301 Sioux Dr
- 6303 Sioux Dr
- 5306 Thunderbird Trail
- 5411 Comanche Vista Trail
- 6305 Sioux Dr
- 5305 Thunderbird Trail
- 6300 Sioux Dr
- 5301 Thunderbird Trail
- 5303 Thunderbird Trail
- 5409 Comanche Vista Trail
- 5209 Thunderbird Trail
- 6302 Sioux Dr
- 6307 Sioux Dr
- 5401 Thunderbird Ct
- 5402 Thunderbird Ct
- 5403 Seminole Ct
- 5204 Thunderbird Trail
- 5207 Thunderbird Trail