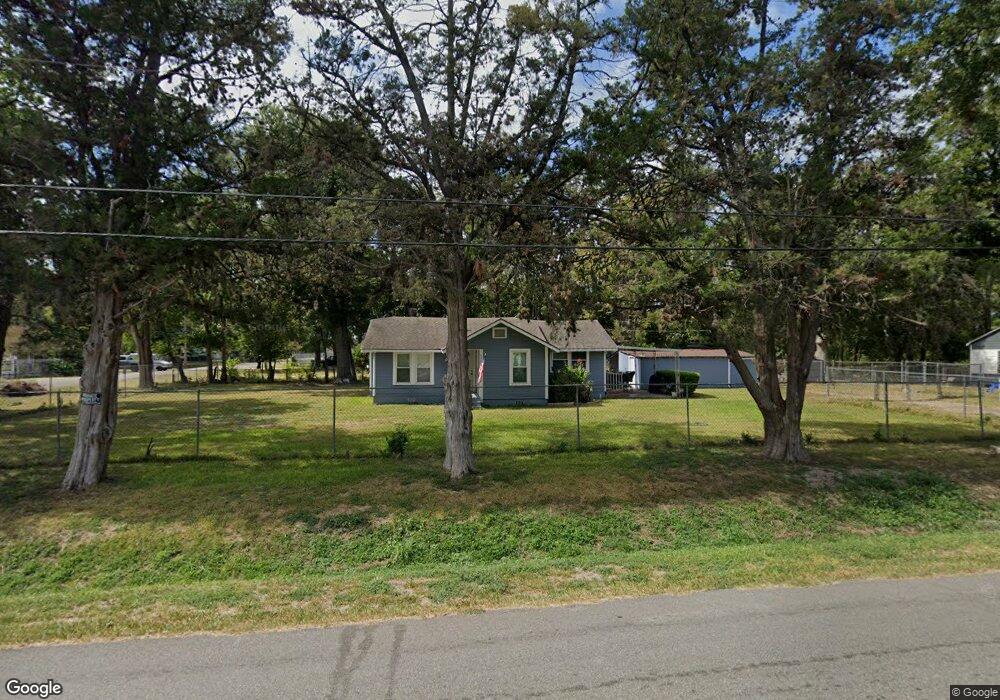
5303 Barrett St Houston, TX 77022
Northside-Northline NeighborhoodEstimated Value: $297,000 - $526,000
3
Beds
2
Baths
2,710
Sq Ft
$142/Sq Ft
Est. Value
About This Home
This home is located at 5303 Barrett St, Houston, TX 77022 and is currently estimated at $385,372, approximately $142 per square foot. 5303 Barrett St is a home located in Harris County with nearby schools including Northline Elementary School, Burbank Middle School, and Sam Houston Math, Science & Technology Center.
Ownership History
Date
Name
Owned For
Owner Type
Purchase Details
Closed on
May 4, 2025
Sold by
Cavazos Mary L
Bought by
Smith Chyrle D
Current Estimated Value
Purchase Details
Closed on
Jan 17, 2011
Sold by
Cavazos Mary Louise
Bought by
Cavazos Mary Louise
Purchase Details
Closed on
May 17, 2002
Sold by
Cavazos Mary Louise
Bought by
Gillory Janice Marie
Purchase Details
Closed on
May 9, 2002
Sold by
Gillory Richard J
Bought by
Gillory Janice Marie
Create a Home Valuation Report for This Property
The Home Valuation Report is an in-depth analysis detailing your home's value as well as a comparison with similar homes in the area
Home Values in the Area
Average Home Value in this Area
Purchase History
| Date | Buyer | Sale Price | Title Company |
|---|---|---|---|
| Smith Chyrle D | -- | None Listed On Document | |
| Cavazos Mary Louise | -- | None Available | |
| Cavazos Mary Louise | -- | None Available | |
| Gillory Janice Marie | -- | -- | |
| Gillory Janice Marie | -- | -- | |
| Gillory Janice Marie | -- | -- | |
| Gillory Janice Marie | -- | -- | |
| Gillory Richard J | -- | -- |
Source: Public Records
Tax History Compared to Growth
Tax History
| Year | Tax Paid | Tax Assessment Tax Assessment Total Assessment is a certain percentage of the fair market value that is determined by local assessors to be the total taxable value of land and additions on the property. | Land | Improvement |
|---|---|---|---|---|
| 2025 | $289 | $369,433 | $212,954 | $156,479 |
| 2024 | $289 | $357,119 | $212,954 | $144,165 |
| 2023 | $289 | $366,000 | $212,954 | $153,046 |
| 2022 | $6,011 | $273,000 | $141,969 | $131,031 |
| 2021 | $5,921 | $254,028 | $141,969 | $112,059 |
| 2020 | $5,709 | $235,769 | $141,969 | $93,800 |
| 2019 | $6,248 | $246,898 | $141,969 | $104,929 |
| 2018 | $3,938 | $155,631 | $94,646 | $60,985 |
| 2017 | $3,935 | $155,631 | $94,646 | $60,985 |
| 2016 | $3,431 | $135,697 | $70,985 | $64,712 |
| 2015 | $3,713 | $127,241 | $70,985 | $56,256 |
| 2014 | $3,713 | $144,449 | $70,985 | $73,464 |
Source: Public Records
Map
Nearby Homes
- 8226 E Tidwell Rd
- 5035 North Fwy
- 5701 Luna St
- 627 Glenburnie Dr
- 0 Burbank St Unit 9886770
- 11 Wellford St Unit G
- Cypress Plan at Wellford Village
- Willow Plan at Wellford Village
- 515 Foxglove Ln
- 423 Gammon Dr
- 40 Dipping Ln
- 5203 Burress Springs Ln
- 9813 Fulton Park Ln
- 302 E Rogers St
- 9815 Fulton Park Ln
- 46 Dipping Ln
- 313 E Tidwell Rd
- 58 Dipping Ln
- 64 Dipping Ln
- 9215 Plan at Fulton Crossing
- 719 E Rogers St
- 5306 Barrett St
- 5302 Barrett St
- 5312 Barrett St
- 724 E Rogers St
- 720 E Rogers St
- 809 E Rogers St
- 5308 Barrett St
- 5220 Barrett St
- 813 E Rogers St
- 810 E Rogers St
- 817 E Rogers St
- 5219 Barrett St
- 814 E Rogers St
- 821 E Rogers St
- 5215 Barrett St
- 818 E Rogers St
- 825 E Rogers St
- 804 E Tidwell Rd
- 710 1/2 E Rogers St