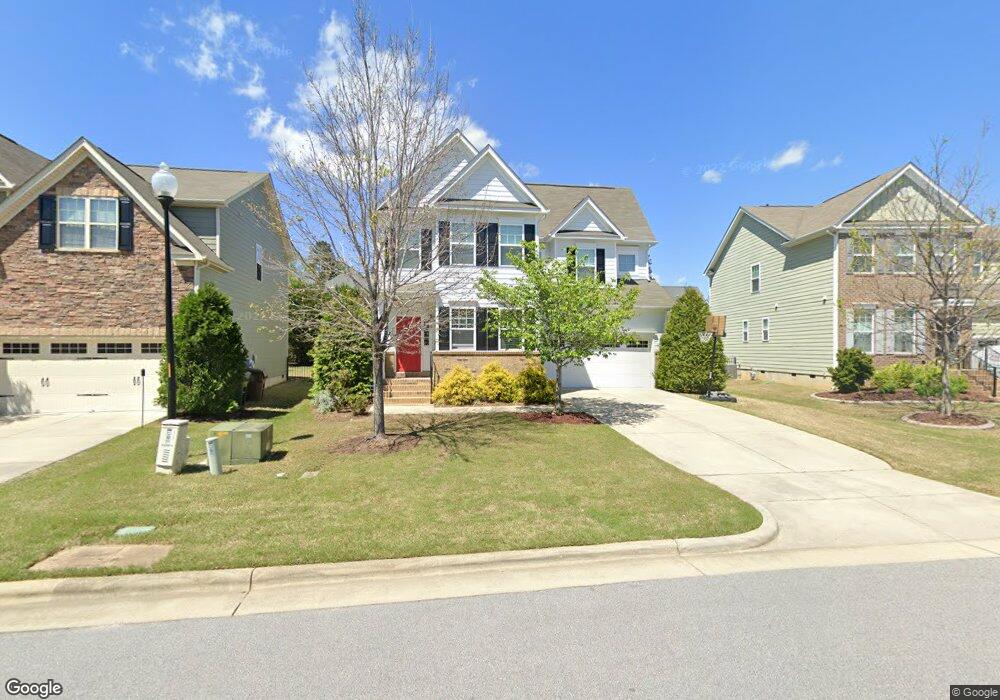
5304 Maplechase Ln Apex, NC 27539
Middle Creek NeighborhoodEstimated Value: $576,000 - $597,000
4
Beds
3
Baths
2,707
Sq Ft
$217/Sq Ft
Est. Value
About This Home
This home is located at 5304 Maplechase Ln, Apex, NC 27539 and is currently estimated at $586,393, approximately $216 per square foot. 5304 Maplechase Ln is a home located in Wake County with nearby schools including West Lake Elementary School, West Lake Middle, and Middle Creek High.
Ownership History
Date
Name
Owned For
Owner Type
Purchase Details
Closed on
Jul 15, 2020
Sold by
Laine Jean Phillippe P J and Laine Paula Mary
Bought by
Nwugo Chika Charles and Nwugo Magdalena Elzbieta
Current Estimated Value
Home Financials for this Owner
Home Financials are based on the most recent Mortgage that was taken out on this home.
Original Mortgage
$309,900
Outstanding Balance
$263,892
Interest Rate
3.1%
Mortgage Type
New Conventional
Estimated Equity
$322,501
Purchase Details
Closed on
Mar 21, 2019
Sold by
Laine Jean Philippe and Laine Paula
Bought by
Laine Jean Philippe P J and Laine Paula Mary
Purchase Details
Closed on
Sep 23, 2010
Sold by
Lennar Carolinas Llc
Bought by
Laine Jean Philippe and Laine Paula
Home Financials for this Owner
Home Financials are based on the most recent Mortgage that was taken out on this home.
Original Mortgage
$227,426
Interest Rate
4.5%
Mortgage Type
FHA
Create a Home Valuation Report for This Property
The Home Valuation Report is an in-depth analysis detailing your home's value as well as a comparison with similar homes in the area
Home Values in the Area
Average Home Value in this Area
Purchase History
| Date | Buyer | Sale Price | Title Company |
|---|---|---|---|
| Nwugo Chika Charles | $360,000 | None Available | |
| Laine Jean Philippe P J | -- | None Available | |
| Laine Living Trust | -- | None Listed On Document | |
| Laine Jean Philippe | $231,000 | None Available |
Source: Public Records
Mortgage History
| Date | Status | Borrower | Loan Amount |
|---|---|---|---|
| Open | Nwugo Chika Charles | $309,900 | |
| Previous Owner | Laine Jean Philippe | $227,426 |
Source: Public Records
Tax History
| Year | Tax Paid | Tax Assessment Tax Assessment Total Assessment is a certain percentage of the fair market value that is determined by local assessors to be the total taxable value of land and additions on the property. | Land | Improvement |
|---|---|---|---|---|
| 2025 | $4,650 | $540,139 | $120,000 | $420,139 |
| 2024 | $4,549 | $540,139 | $120,000 | $420,139 |
Source: Public Records
Map
Nearby Homes
- 7404 Bedford Ridge Dr
- 7309 Bedford Ridge Dr
- 7243 Capulin Crest Dr
- 4913 Mashpee Ln
- 5340 Serene Forest Dr
- 8649 Glade Hill Dr
- 4412 Fairview Ridge Ln
- 8313 Covington Hill Way
- 409 Wanderview Ln
- 273 Meadow Beauty Dr
- 5045 Homeplace Dr
- 208 Brookberry Rd
- 417 Redhill Rd
- 104 Tatum Ct
- 212 Sea Biscuit Ln Unit 25
- 3601 Lebrun Path
- 213 Cross Oaks Place
- 608 Skygrove Dr
- 0 Optimist Farm Rd Unit 10126506
- 221 Thorndale Dr
- 5308 Maplechase Ln
- 5300 Maplechase Ln
- 5312 Maplechase Ln
- 5221 Greymoss Ln
- 5225 Greymoss Ln
- 5225 Greymoss Ln Unit L199
- 5212 Maplechase Ln
- 5229 Greymoss Ln
- 5229 Greymoss Ln Unit 200
- 7100 Hinman Ln
- 5217 Greymoss Ln
- 5217 Greymoss Ln Unit Lt197
- 5316 Maplechase Ln
- 5208 Maplechase Ln
- 5209 Greymoss Ln
- 5233 Greymoss Ln Unit 201
- 5205 Greymoss Ln
- 5205 Greymoss Ln Unit L195
- 5320 Maplechase Ln
- 7104 Hinman Ln
Your Personal Tour Guide
Ask me questions while you tour the home.