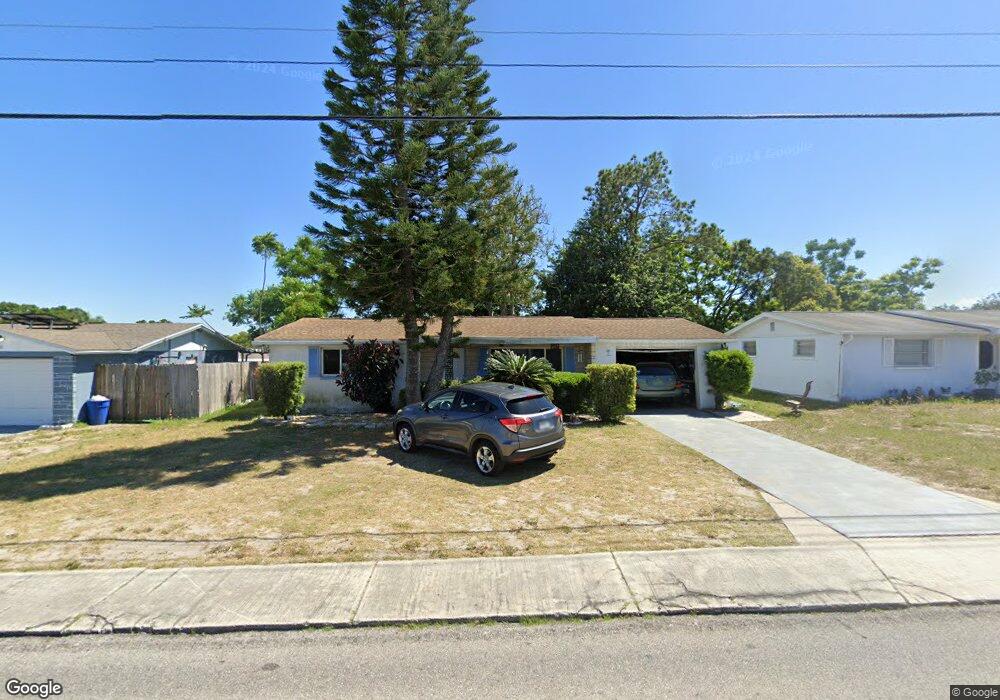
5304 Moog Rd Holiday, FL 34690
Estimated Value: $174,856 - $256,000
2
Beds
2
Baths
1,128
Sq Ft
$200/Sq Ft
Est. Value
About This Home
This home is located at 5304 Moog Rd, Holiday, FL 34690 and is currently estimated at $225,464, approximately $199 per square foot. 5304 Moog Rd is a home located in Pasco County with nearby schools including Anclote Elementary School, Paul R. Smith Middle School, and Anclote High School.
Ownership History
Date
Name
Owned For
Owner Type
Purchase Details
Closed on
Jan 20, 2017
Sold by
Salerno Janice
Bought by
Gotis Investments Properties 5 Llc
Current Estimated Value
Purchase Details
Closed on
Mar 1, 2016
Bought by
Gotsis Investment Properties
Purchase Details
Closed on
Dec 4, 2002
Sold by
Mcgugart Edna J
Bought by
Mcgugart Robert K
Purchase Details
Closed on
May 12, 1997
Sold by
Gugart Robert K Mc
Bought by
Mcgugart Donald J and Mc Gugart Edna J
Create a Home Valuation Report for This Property
The Home Valuation Report is an in-depth analysis detailing your home's value as well as a comparison with similar homes in the area
Home Values in the Area
Average Home Value in this Area
Purchase History
| Date | Buyer | Sale Price | Title Company |
|---|---|---|---|
| Gotis Investments Properties 5 Llc | $52,000 | Affiliated Title Services In | |
| Gotsis Investment Properties | $100 | -- | |
| Mcgugart Robert K | -- | -- | |
| Mcgugart Donald J | $100 | -- |
Source: Public Records
Mortgage History
| Date | Status | Borrower | Loan Amount |
|---|---|---|---|
| Previous Owner | Mcgugart Donald J | -- |
Source: Public Records
Tax History
| Year | Tax Paid | Tax Assessment Tax Assessment Total Assessment is a certain percentage of the fair market value that is determined by local assessors to be the total taxable value of land and additions on the property. | Land | Improvement |
|---|---|---|---|---|
| 2026 | $2,599 | $159,924 | $33,966 | $125,958 |
| 2025 | $2,599 | $159,924 | $33,966 | $125,958 |
| 2024 | $2,599 | $173,108 | $31,824 | $141,284 |
| 2023 | $2,417 | $109,080 | $0 | $0 |
| 2022 | $1,888 | $120,262 | $21,216 | $99,046 |
| 2021 | $1,727 | $104,061 | $16,830 | $87,231 |
| 2020 | $1,517 | $81,965 | $10,863 | $71,102 |
| 2019 | $1,483 | $82,770 | $10,863 | $71,907 |
| 2018 | $1,335 | $70,400 | $10,863 | $59,537 |
| 2017 | $1,175 | $59,364 | $10,863 | $48,501 |
| 2016 | $956 | $51,670 | $10,863 | $40,807 |
| 2015 | $430 | $41,159 | $0 | $0 |
| 2014 | $410 | $40,832 | $10,200 | $30,632 |
Source: Public Records
Map
Nearby Homes
- 3420 Chickadee Dr
- 5245 Bluejay Dr
- 3412 Peterborough St
- 5253 Falcon Dr
- 5134 Reseda Dr
- 3632 Pensdale Dr
- 5226 Falcon Dr
- 3650 Pensdale Dr
- 3709 Panola Dr
- 0 Grand Blvd
- 3420 Lanark Dr
- 5123 Mecaslin Dr
- 3348 Lanark Dr
- 3405 Lanark Dr
- 5633 Andrea Dr Unit 1
- 3645 Colonial Hills Dr
- 3651 Colonial Hills Dr
- 5209 Beacon Hill Dr
- 5647 Elkhorn Blvd
- 3648 Linkwood St
Your Personal Tour Guide
Ask me questions while you tour the home.