5304 NE 84th Loop Unit D17 Vancouver, WA 98662
Minnehaha NeighborhoodEstimated Value: $245,000 - $299,000
2
Beds
2
Baths
1,040
Sq Ft
$257/Sq Ft
Est. Value
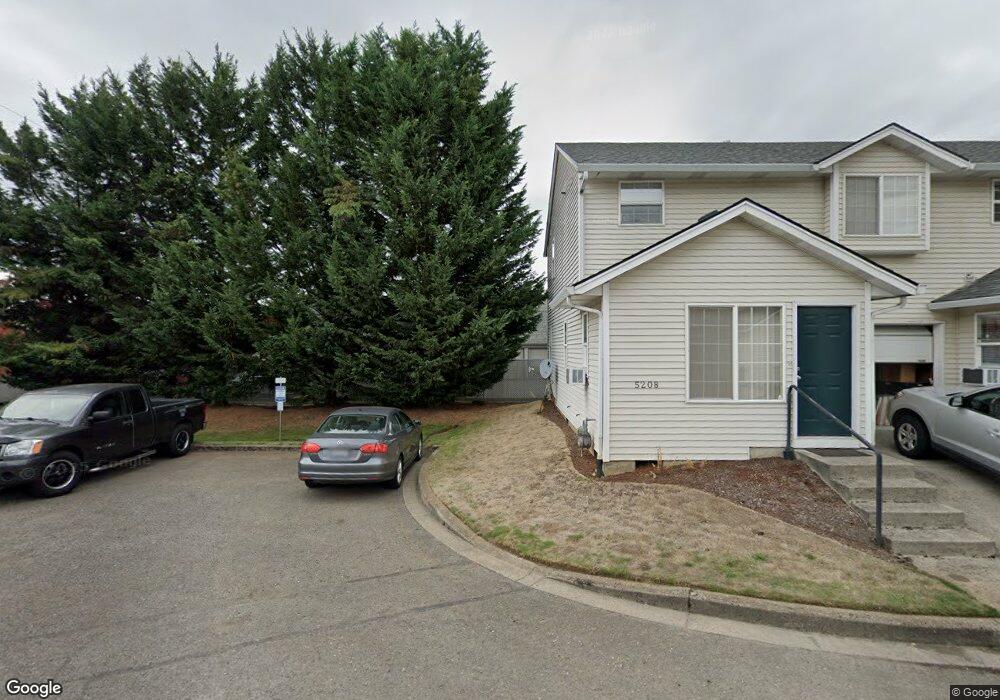
About This Home
This home is located at 5304 NE 84th Loop Unit D17, Vancouver, WA 98662 and is currently estimated at $267,073, approximately $256 per square foot. 5304 NE 84th Loop Unit D17 is a home located in Clark County with nearby schools including Walnut Grove Elementary, Gaiser Middle School, and Fort Vancouver High School.
Ownership History
Date
Name
Owned For
Owner Type
Purchase Details
Closed on
Apr 24, 2023
Sold by
Lau Cuong S
Bought by
Lau Chin-Jaan C
Current Estimated Value
Purchase Details
Closed on
Mar 9, 2011
Sold by
Burmester Jari
Bought by
Lau Cuong and Lau Chin Jaan
Purchase Details
Closed on
Jun 3, 2005
Sold by
Alford Kristin
Bought by
Burmester Jari
Home Financials for this Owner
Home Financials are based on the most recent Mortgage that was taken out on this home.
Original Mortgage
$91,519
Interest Rate
6.8%
Mortgage Type
Fannie Mae Freddie Mac
Purchase Details
Closed on
Mar 27, 2003
Sold by
Stratton Dean W
Bought by
Alford Kristin
Home Financials for this Owner
Home Financials are based on the most recent Mortgage that was taken out on this home.
Original Mortgage
$82,935
Interest Rate
5.79%
Mortgage Type
FHA
Purchase Details
Closed on
Mar 26, 2002
Sold by
Stratton Dean W
Bought by
Stratton Dean W
Create a Home Valuation Report for This Property
The Home Valuation Report is an in-depth analysis detailing your home's value as well as a comparison with similar homes in the area
Home Values in the Area
Average Home Value in this Area
Purchase History
| Date | Buyer | Sale Price | Title Company |
|---|---|---|---|
| Lau Chin-Jaan C | -- | None Listed On Document | |
| Lau Cuong | $62,000 | Stewart Title | |
| Burmester Jari | $114,398 | Clark County Title Company | |
| Alford Kristin | $85,500 | Clark County Title | |
| Stratton Dean W | -- | -- |
Source: Public Records
Mortgage History
| Date | Status | Borrower | Loan Amount |
|---|---|---|---|
| Previous Owner | Burmester Jari | $91,519 | |
| Previous Owner | Alford Kristin | $82,935 | |
| Closed | Burmester Jari | $22,879 |
Source: Public Records
Tax History Compared to Growth
Tax History
| Year | Tax Paid | Tax Assessment Tax Assessment Total Assessment is a certain percentage of the fair market value that is determined by local assessors to be the total taxable value of land and additions on the property. | Land | Improvement |
|---|---|---|---|---|
| 2025 | $2,242 | $222,338 | -- | $222,338 |
| 2024 | $2,152 | $229,947 | -- | $229,947 |
| 2023 | $1,873 | $96,166 | $0 | $96,166 |
| 2022 | $1,918 | $201,408 | $0 | $201,408 |
| 2021 | $1,827 | $192,142 | $0 | $192,142 |
| 2020 | $1,621 | $171,883 | $25,000 | $146,883 |
| 2019 | $1,396 | $158,113 | $25,000 | $133,113 |
| 2018 | $1,466 | $140,982 | $0 | $0 |
| 2017 | $1,294 | $122,941 | $0 | $0 |
| 2016 | $1,108 | $113,175 | $0 | $0 |
| 2015 | $1,099 | $92,548 | $0 | $0 |
| 2014 | -- | $86,814 | $0 | $0 |
| 2013 | -- | $98,346 | $0 | $0 |
Source: Public Records
Map
Nearby Homes
- 5333 NE 83rd Place
- 5304 NE 84th Loop Unit D16
- 5508 NE 84th Ave
- 5700 NE 82nd Ave Unit C15
- 5700 NE 82nd Ave Unit 32F
- 5544 NE 89th Ave Unit B4
- 7509 NE 53rd St
- 8715 NE 58th St
- 5812 NE 80th Ct
- 8406 NE 60th St
- 5309 NE 75th Ave
- 7900 NE Loowit Loop Unit 59
- 5118 NE 76th Ave
- 6016 NE 81st Ave
- 8013 NE 60th Cir
- 8015 NE 61st St
- 7824 NE Loowit Loop Unit 70
- 8501 NE 62nd St
- 7501 NE 51st Way
- 4701 NE 77th Ave Unit 36
- 5304 NE 84th Loop Unit 8
- 5304 NE 84th Loop Unit 3
- 5304 NE 84th Loop Unit 1
- 5304 NE 84th Loop
- 5304 NE 84th Loop Unit D20
- 5304 NE 84th Loop Unit D19
- 5304 NE 84th Loop Unit D18
- 5304 NE 84th Loop Unit D15
- 5304 NE 84th Loop Unit D14
- 5304 NE 84th Loop Unit D13
- 5304 NE 84th Loop Unit D12
- 5304 NE 84th Loop Unit D11
- 5304 NE 84th Loop Unit D10
- 5304 NE 84th Loop Unit D9
- 5304 NE 84th Loop Unit D8
- 5304 NE 84th Loop Unit D7
- 5304 NE 84th Loop Unit D6
- 5304 NE 84th Loop Unit D5
- 5304 NE 84th Loop Unit D4
- 5304 NE 84th Loop Unit D3