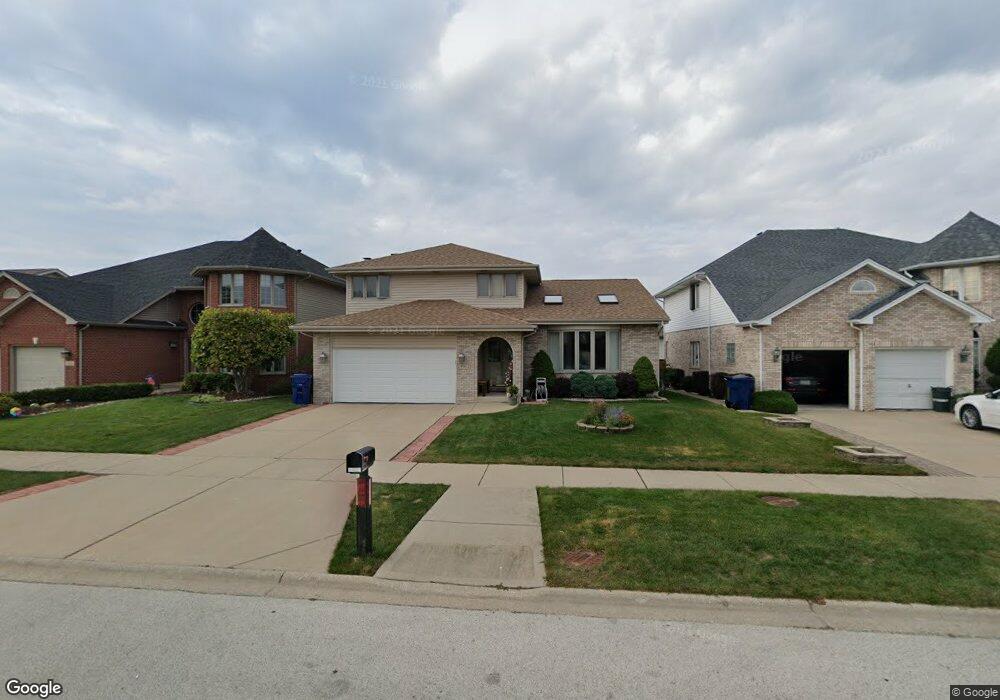
5304 W 109th St Oak Lawn, IL 60453
Estimated Value: $499,368 - $519,000
3
Beds
3
Baths
2,499
Sq Ft
$204/Sq Ft
Est. Value
About This Home
This home is located at 5304 W 109th St, Oak Lawn, IL 60453 and is currently estimated at $509,092, approximately $203 per square foot. 5304 W 109th St is a home located in Cook County with nearby schools including Stony Creek Elementary School, Prairie Jr High School, and Harold L. Richards High School.
Ownership History
Date
Name
Owned For
Owner Type
Purchase Details
Closed on
Nov 17, 2023
Sold by
Andres Family 2022 Trust and Andres Janeiro C
Bought by
Alesayi Naji N and Muthana Yousef
Current Estimated Value
Home Financials for this Owner
Home Financials are based on the most recent Mortgage that was taken out on this home.
Original Mortgage
$344,415
Outstanding Balance
$338,732
Interest Rate
7.79%
Mortgage Type
New Conventional
Estimated Equity
$170,360
Purchase Details
Closed on
Dec 5, 2022
Sold by
Andres Janeiro C and Andres Leonila F
Bought by
Andres Family 2022 Trust and Andres
Purchase Details
Closed on
May 15, 2003
Sold by
Nlsb
Bought by
Andres Janeiro C and Andres Leonila F
Home Financials for this Owner
Home Financials are based on the most recent Mortgage that was taken out on this home.
Original Mortgage
$225,300
Interest Rate
5.78%
Mortgage Type
Unknown
Create a Home Valuation Report for This Property
The Home Valuation Report is an in-depth analysis detailing your home's value as well as a comparison with similar homes in the area
Home Values in the Area
Average Home Value in this Area
Purchase History
| Date | Buyer | Sale Price | Title Company |
|---|---|---|---|
| Alesayi Naji N | $431,000 | Old Republic Title | |
| Andres Family 2022 Trust | -- | None Listed On Document | |
| Andres Janeiro C | $307,000 | Ctic | |
| Andres Janeiro C | $307,000 | Ctic |
Source: Public Records
Mortgage History
| Date | Status | Borrower | Loan Amount |
|---|---|---|---|
| Open | Alesayi Naji N | $344,415 | |
| Previous Owner | Andres Janeiro C | $225,300 |
Source: Public Records
Tax History Compared to Growth
Tax History
| Year | Tax Paid | Tax Assessment Tax Assessment Total Assessment is a certain percentage of the fair market value that is determined by local assessors to be the total taxable value of land and additions on the property. | Land | Improvement |
|---|---|---|---|---|
| 2024 | $10,623 | $41,000 | $6,105 | $34,895 |
| 2023 | $7,618 | $41,000 | $6,105 | $34,895 |
| 2022 | $7,618 | $26,772 | $5,280 | $21,492 |
| 2021 | $7,317 | $26,771 | $5,280 | $21,491 |
| 2020 | $7,420 | $26,771 | $5,280 | $21,491 |
| 2019 | $6,761 | $24,977 | $4,785 | $20,192 |
| 2018 | $7,446 | $24,977 | $4,785 | $20,192 |
| 2017 | $8,793 | $28,451 | $4,785 | $23,666 |
| 2016 | $8,163 | $24,527 | $3,960 | $20,567 |
| 2015 | $8,105 | $24,527 | $3,960 | $20,567 |
| 2014 | $10,420 | $31,404 | $3,960 | $27,444 |
| 2013 | $8,072 | $26,801 | $3,960 | $22,841 |
Source: Public Records
Map
Nearby Homes
- 11028 Jodan Dr
- 10737 Long Ave
- 11000 Deblin Ln
- 5120 Deblin Ln
- 11001 Deblin Ln Unit 203
- 10720 Laramie Ave
- 5111 Deblin Ln Unit 3B
- 10930 Central Ave Unit 1B
- 11000 Central Ave Unit 2C
- 11010 Central Ave Unit 3A
- 10816 Leclaire Ave
- 10652 Laramie Ave
- 10710 Central Ave Unit 3D
- 10724 Lawler Ave
- 5730 110th St
- 10540 Lockwood Ave
- 11152 S Lawler Ave
- 10624 S Central Ave Unit 1
- 10713 Lawler Ave
- 10620 S Central Ave Unit 1A
- 5308 W 109th St
- 5300 W 109th St
- 5250 W 109th St
- 5312 W 109th St
- 5317 W 108th Place
- 5313 W 108th Place
- 5321 W 108th Place
- 5309 W 108th Place
- 5246 W 109th St
- 5316 W 109th St
- 5325 W 108th Place
- 5305 W 109th St Unit 5305
- 5305 W 108th Place
- 5245 W 109th St
- 5242 W 109th St
- 5320 W 109th St
- 5329 W 108th Place
- 5301 W 108th Place
- 5241 W 109th St
- 5303 W 109th St Unit 5303