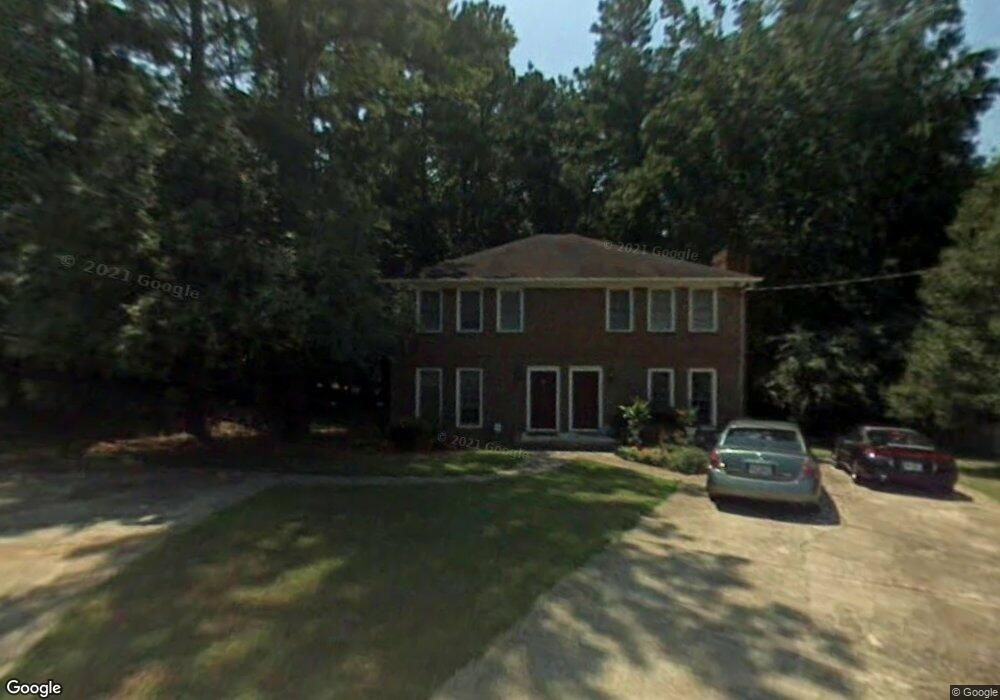
5304 Wexford Ct Norcross, GA 30071
Estimated Value: $400,314 - $479,000
4
Beds
4
Baths
2,508
Sq Ft
$182/Sq Ft
Est. Value
About This Home
This home is located at 5304 Wexford Ct, Norcross, GA 30071 and is currently estimated at $456,829, approximately $182 per square foot. 5304 Wexford Ct is a home located in Gwinnett County with nearby schools including Norcross Elementary School, Summerour Middle School, and Norcross High School.
Ownership History
Date
Name
Owned For
Owner Type
Purchase Details
Closed on
Jul 21, 2009
Sold by
Lau-Sanderson Isabella
Bought by
5304 A & B Wexford Court Land
Current Estimated Value
Purchase Details
Closed on
Mar 13, 2009
Sold by
5304 A & B Wexford Court Land
Bought by
Lau-Sanderson Isabella and Sanderson James
Purchase Details
Closed on
Dec 7, 2005
Sold by
Sanderson James H and Sanderson Isabella
Bought by
Freeport Title & Guaranty Inc
Purchase Details
Closed on
Nov 19, 2001
Sold by
Gibson Victor E
Bought by
Sanderson James H and Sanderson Isabella
Home Financials for this Owner
Home Financials are based on the most recent Mortgage that was taken out on this home.
Original Mortgage
$124,000
Interest Rate
6.54%
Purchase Details
Closed on
Mar 2, 1999
Sold by
Gibson Victor E
Bought by
Gibson Victor E
Purchase Details
Closed on
Feb 25, 1999
Sold by
Bingham Mary Martha
Bought by
Gibosn Victor E
Create a Home Valuation Report for This Property
The Home Valuation Report is an in-depth analysis detailing your home's value as well as a comparison with similar homes in the area
Home Values in the Area
Average Home Value in this Area
Purchase History
| Date | Buyer | Sale Price | Title Company |
|---|---|---|---|
| 5304 A & B Wexford Court Land | -- | -- | |
| Lau-Sanderson Isabella | -- | -- | |
| Freeport Title & Guaranty Inc | -- | -- | |
| Sanderson James H | $155,000 | -- | |
| Gibson Victor E | -- | -- | |
| Gibosn Victor E | -- | -- |
Source: Public Records
Mortgage History
| Date | Status | Borrower | Loan Amount |
|---|---|---|---|
| Previous Owner | Sanderson James H | $124,000 |
Source: Public Records
Tax History Compared to Growth
Tax History
| Year | Tax Paid | Tax Assessment Tax Assessment Total Assessment is a certain percentage of the fair market value that is determined by local assessors to be the total taxable value of land and additions on the property. | Land | Improvement |
|---|---|---|---|---|
| 2025 | $5,199 | $164,520 | $17,280 | $147,240 |
| 2024 | $4,872 | $152,240 | $20,000 | $132,240 |
| 2023 | $4,872 | $132,480 | $20,000 | $112,480 |
| 2022 | $4,253 | $132,480 | $20,000 | $112,480 |
| 2021 | $2,574 | $78,480 | $16,000 | $62,480 |
| 2020 | $2,594 | $78,480 | $16,000 | $62,480 |
| 2019 | $3,355 | $78,480 | $16,000 | $62,480 |
| 2018 | $2,598 | $78,480 | $16,000 | $62,480 |
| 2016 | $1,792 | $54,200 | $8,000 | $46,200 |
| 2015 | $2,337 | $54,200 | $8,000 | $46,200 |
| 2014 | $945 | $28,000 | $8,000 | $20,000 |
Source: Public Records
Map
Nearby Homes
- 5341 Goodwick Way
- 2199 Summertown Dr
- 5381 Station Cir Unit 3
- 4242 Morrison Lake Trail
- 2066 Pinnacle Pointe Dr
- 5457 Rails Way
- 2340 Beaver Ruin Rd Unit 26
- 2340 Beaver Ruin Rd Unit 41
- 2340 Beaver Ruin Rd
- 2340 Beaver Ruin Rd Unit 15
- 2340 Beaver Ruin Rd Unit 16
- 5477 Windy Creek Ln
- 5479 Windy Creek Ln
- 2037 Pinnacle Pointe Dr
- 2325 E Hill Way NW
- 2375 Beaver Falls Dr
- 5106 Rockborough Trail
- 5364 Hickory Knoll
- 5358 Beaver Branch
- 5357 Beaver Branch
- 2182 Wexford Dr
- 2182 Wexford Dr Unit B
- 2182 Wexford Dr Unit A
- 5314 Wexford Ct
- 5314 Weford Ct
- 5294 Wexford Ct
- 2172 Wexford Dr
- 5315 Wexford Ct Unit A
- 5315 Wexford Ct
- 2171 Wexford Dr
- 2171 Wexford Dr Unit B
- 2162 Wexford Dr
- 5305 Wexford Ct
- 5305 Wexford Ct Unit B
- 2181 Wexford Dr
- 2202 Wexford Dr
- 2179 Newbury Rd Unit 1
- 2185 Newbury Rd
- 2191 Wexford Dr
- 5334 Coventry Ct