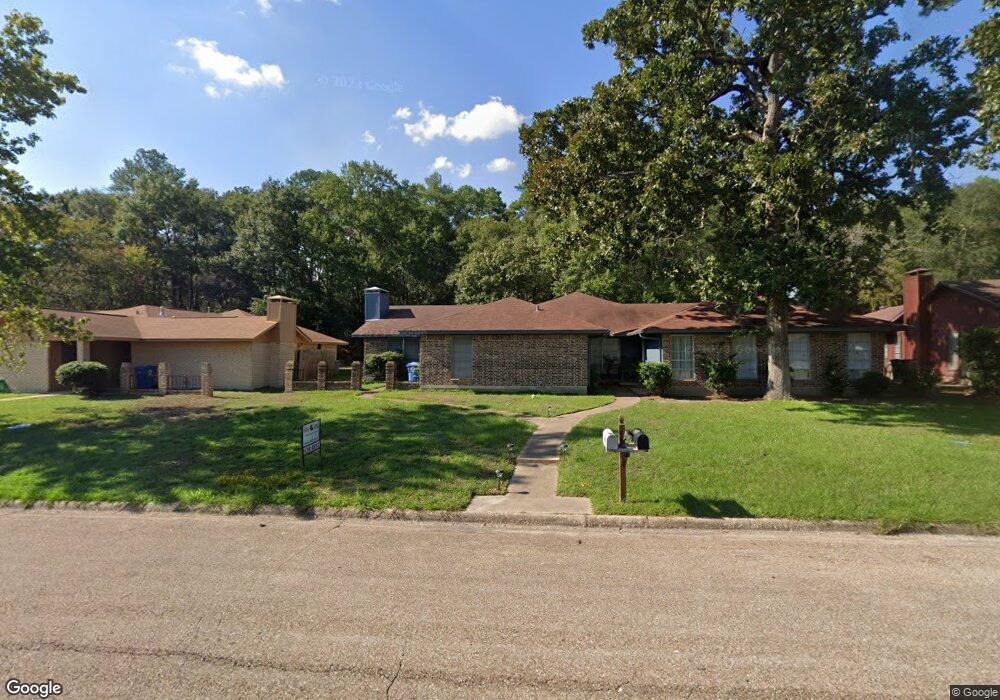
5305 Champions Dr Unit 5307 Lufkin, TX 75901
Estimated Value: $100,000 - $321,000
--
Bed
14
Baths
5,148
Sq Ft
$48/Sq Ft
Est. Value
About This Home
This home is located at 5305 Champions Dr Unit 5307, Lufkin, TX 75901 and is currently estimated at $247,884, approximately $48 per square foot. 5305 Champions Dr Unit 5307 is a home located in Angelina County with nearby schools including Kurth Primary School, Anderson Elementary School, and Lufkin Middle School.
Ownership History
Date
Name
Owned For
Owner Type
Purchase Details
Closed on
Nov 1, 2023
Sold by
Vander Leest Alvin and Vander Taliah
Bought by
Vander Leest Properties Llc
Current Estimated Value
Purchase Details
Closed on
May 29, 2014
Sold by
Beaver Seth J and Beaver Elizabeth
Bought by
Vander Alvin J and Vander Leest Taliah M
Home Financials for this Owner
Home Financials are based on the most recent Mortgage that was taken out on this home.
Original Mortgage
$150,000
Interest Rate
4.32%
Mortgage Type
Purchase Money Mortgage
Purchase Details
Closed on
Nov 1, 2010
Sold by
Lewis Rev B W and Lewis Ann W
Bought by
Beaver Seth J and Beaver Elizabeth
Home Financials for this Owner
Home Financials are based on the most recent Mortgage that was taken out on this home.
Original Mortgage
$131,750
Interest Rate
4.41%
Mortgage Type
Purchase Money Mortgage
Create a Home Valuation Report for This Property
The Home Valuation Report is an in-depth analysis detailing your home's value as well as a comparison with similar homes in the area
Home Values in the Area
Average Home Value in this Area
Purchase History
| Date | Buyer | Sale Price | Title Company |
|---|---|---|---|
| Vander Leest Properties Llc | -- | None Listed On Document | |
| Vander Alvin J | -- | None Available | |
| Beaver Seth J | $131,750 | None Available |
Source: Public Records
Mortgage History
| Date | Status | Borrower | Loan Amount |
|---|---|---|---|
| Previous Owner | Vander Alvin J | $150,000 | |
| Previous Owner | Beaver Seth J | $131,750 |
Source: Public Records
Tax History Compared to Growth
Tax History
| Year | Tax Paid | Tax Assessment Tax Assessment Total Assessment is a certain percentage of the fair market value that is determined by local assessors to be the total taxable value of land and additions on the property. | Land | Improvement |
|---|---|---|---|---|
| 2025 | $5,373 | $257,130 | $22,160 | $234,970 |
| 2024 | $5,257 | $251,560 | $22,160 | $229,400 |
| 2023 | $4,925 | $247,840 | $22,160 | $225,680 |
| 2022 | $3,633 | $159,520 | $15,290 | $144,230 |
| 2021 | $3,683 | $149,500 | $15,290 | $134,210 |
| 2020 | $3,789 | $154,190 | $15,290 | $138,900 |
| 2019 | $4,008 | $154,190 | $15,290 | $138,900 |
| 2018 | $3,461 | $149,590 | $15,290 | $134,300 |
| 2017 | $3,461 | $145,180 | $15,290 | $129,890 |
| 2016 | $3,478 | $145,890 | $15,290 | $130,600 |
| 2015 | $3,218 | $145,890 | $15,290 | $130,600 |
| 2014 | $3,218 | $148,380 | $15,290 | $133,090 |
Source: Public Records
Map
Nearby Homes
- 5302 Champions Dr
- 5301 Champions Dr Unit 5303
- 5313 Champions Dr Unit 5314
- 5208 Champions Dr
- 5209 Champions Dr Unit 5211
- 5201 Champions Dr Unit 5203
- 5310 Champions Dr
- 5309 Champions Dr Unit 5311
- 4 Colonial Ct
- 5202 Champions Dr
- 3 Colonial Ct
- 5205 Champions Dr Unit 5207
- 5314 Champions Dr
- 7 Lakewood Ct
- 2 Colonial Ct
- 6 Lakewood Ct
- 5409 Champions Dr Unit 5411
- 5401 Champions Dr Unit 5403
- 115 Westchester St
- 5109 Champions Dr Unit 5111