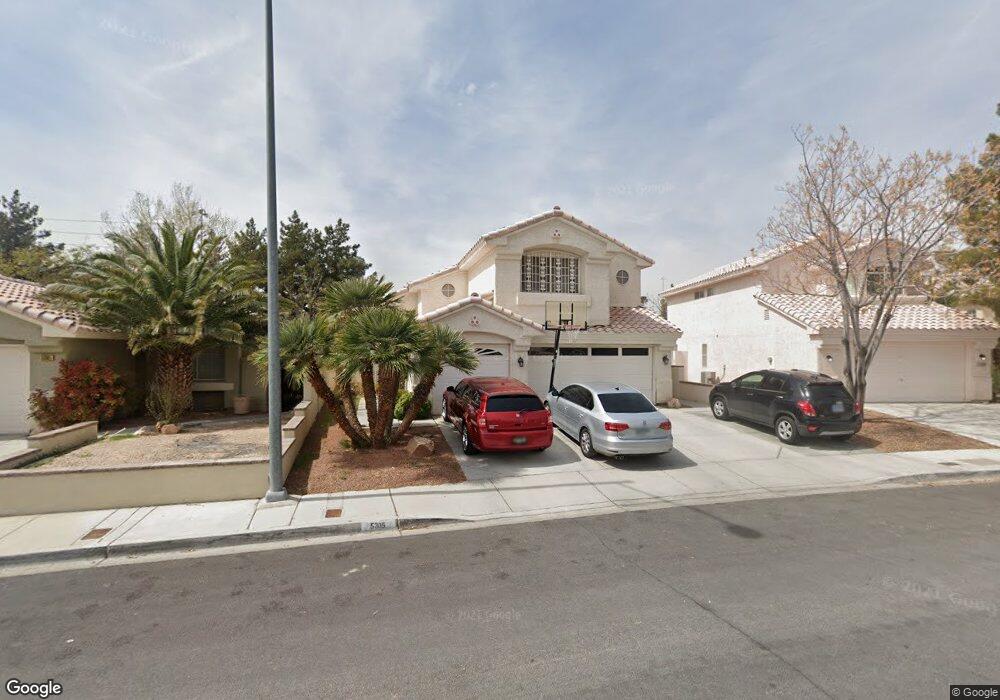
5305 Standing Rock Place Las Vegas, NV 89130
Estimated Value: $434,584 - $476,000
3
Beds
3
Baths
1,835
Sq Ft
$250/Sq Ft
Est. Value
About This Home
This home is located at 5305 Standing Rock Place, Las Vegas, NV 89130 and is currently estimated at $458,396, approximately $249 per square foot. 5305 Standing Rock Place is a home located in Clark County with nearby schools including Ernest May Elementary School, Theron L Swainston Middle School, and Shadow Ridge High School.
Ownership History
Date
Name
Owned For
Owner Type
Purchase Details
Closed on
Mar 29, 2004
Sold by
Graves Bernard and Graves Priscilla
Bought by
Harris Stephen L and Harris Rita W
Current Estimated Value
Home Financials for this Owner
Home Financials are based on the most recent Mortgage that was taken out on this home.
Original Mortgage
$196,800
Outstanding Balance
$92,030
Interest Rate
5.57%
Mortgage Type
Unknown
Estimated Equity
$366,366
Purchase Details
Closed on
Oct 7, 1994
Sold by
Rancho Santa Fe Residential Ltd Prtnrshp
Bought by
Graves Bernard and Graves Priscilla
Home Financials for this Owner
Home Financials are based on the most recent Mortgage that was taken out on this home.
Original Mortgage
$116,002
Interest Rate
8.7%
Mortgage Type
VA
Create a Home Valuation Report for This Property
The Home Valuation Report is an in-depth analysis detailing your home's value as well as a comparison with similar homes in the area
Home Values in the Area
Average Home Value in this Area
Purchase History
| Date | Buyer | Sale Price | Title Company |
|---|---|---|---|
| Harris Stephen L | $246,000 | North American Title Co | |
| Graves Bernard | $127,500 | Nevada Title Company |
Source: Public Records
Mortgage History
| Date | Status | Borrower | Loan Amount |
|---|---|---|---|
| Open | Harris Stephen L | $196,800 | |
| Previous Owner | Graves Bernard | $116,002 | |
| Closed | Harris Stephen L | $36,900 |
Source: Public Records
Tax History Compared to Growth
Tax History
| Year | Tax Paid | Tax Assessment Tax Assessment Total Assessment is a certain percentage of the fair market value that is determined by local assessors to be the total taxable value of land and additions on the property. | Land | Improvement |
|---|---|---|---|---|
| 2025 | $1,598 | $94,236 | $35,000 | $59,236 |
| 2024 | $1,552 | $94,236 | $35,000 | $59,236 |
| 2023 | $1,188 | $86,179 | $29,750 | $56,429 |
| 2022 | $1,652 | $77,775 | $25,900 | $51,875 |
| 2021 | $1,530 | $73,223 | $23,800 | $49,423 |
| 2020 | $1,418 | $70,161 | $21,000 | $49,161 |
| 2019 | $1,329 | $68,835 | $20,300 | $48,535 |
| 2018 | $1,268 | $59,937 | $13,300 | $46,637 |
| 2017 | $1,989 | $60,673 | $13,300 | $47,373 |
| 2016 | $1,188 | $54,782 | $10,500 | $44,282 |
| 2015 | $1,184 | $41,855 | $7,000 | $34,855 |
| 2014 | $1,150 | $36,698 | $7,000 | $29,698 |
Source: Public Records
Map
Nearby Homes
- 6904 Indian Chief Dr Unit 201
- 28460 U S Route 95
- 6705 Squaw Mountain Dr Unit 102
- 6808 Indian Chief Dr Unit 204
- 6701 Squaw Mountain Dr Unit 201
- 5152 Forest Oaks Dr
- 5144 Forest Oaks Dr
- 6704 Indian Chief Dr Unit 101
- 5116 Jordan Frey St Unit 201
- 5409 Flora Spray St
- 7208 Painted Shadows Way
- 5512 Goldbrush St
- 7268 Drifting River Ct
- 5041 Portraits Place
- 5024 Saint Annes Dr
- 6513 Echo Crest Ave
- 5237 Crooked Sky Cir
- 7250 Diamond Canyon Ln Unit 204
- 5009 Forest Oaks Dr
- 6613 Sand Bench Ave
- 5301 Standing Rock Place
- 5309 Standing Rock Place
- 5241 Standing Rock Place
- 5313 Standing Rock Place
- 5237 Standing Rock Place
- 5317 Standing Rock Place Unit 2
- 5308 Standing Rock Place
- 5300 Standing Rock Place
- 5233 Standing Rock Place
- 5312 Standing Rock Place Unit N
- 5312 Standing Rock Place
- 5240 Standing Rock Place
- 5321 Standing Rock Place
- 5316 Standing Rock Place
- 5236 Standing Rock Place
- 5229 Standing Rock Place
- 5325 Standing Rock Place
- 5232 Standing Rock Place
- 5320 Standing Rock Place
- 5309 White Coyote Place