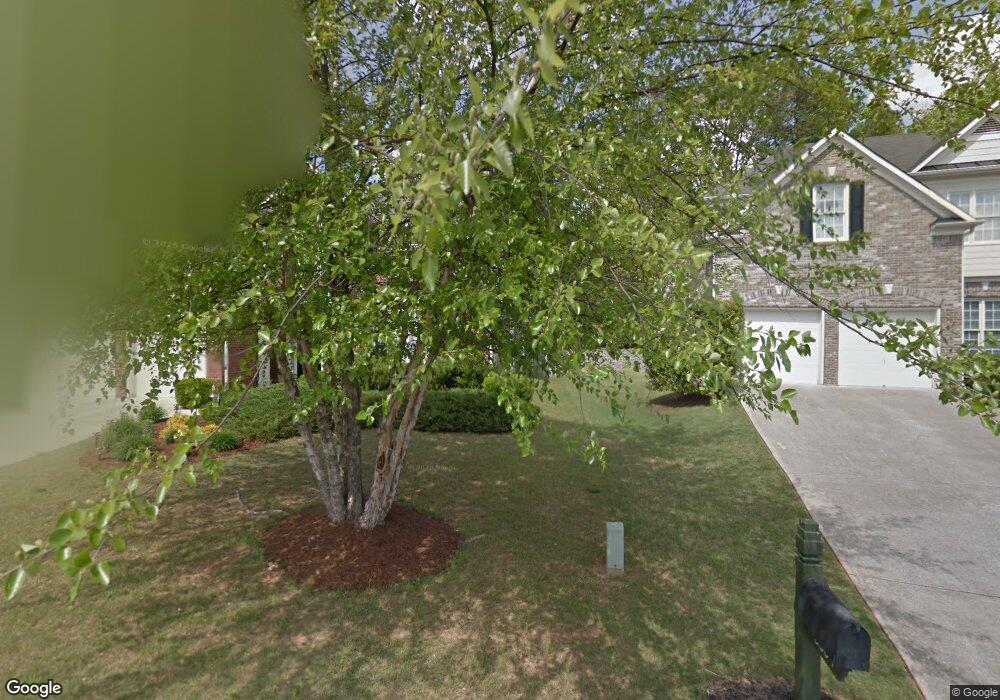
5306 Vinings Lake View SW Mableton, GA 30126
Estimated Value: $479,827 - $525,000
4
Beds
3
Baths
2,672
Sq Ft
$188/Sq Ft
Est. Value
About This Home
This home is located at 5306 Vinings Lake View SW, Mableton, GA 30126 and is currently estimated at $501,707, approximately $187 per square foot. 5306 Vinings Lake View SW is a home located in Cobb County with nearby schools including Clay-Harmony Leland Elementary School, Lindley Middle School, and Pebblebrook High School.
Ownership History
Date
Name
Owned For
Owner Type
Purchase Details
Closed on
May 20, 2011
Sold by
Mcbride David and Mcbride Melissa
Bought by
Whitfield Melanie L
Current Estimated Value
Home Financials for this Owner
Home Financials are based on the most recent Mortgage that was taken out on this home.
Original Mortgage
$209,000
Outstanding Balance
$144,124
Interest Rate
4.79%
Mortgage Type
New Conventional
Estimated Equity
$357,583
Purchase Details
Closed on
Oct 29, 2002
Sold by
Wells Fargo Bank West Na
Bought by
Mcbride David
Purchase Details
Closed on
Mar 28, 2001
Sold by
Traton Corp Of Cobb Co
Bought by
Mcbridge David
Home Financials for this Owner
Home Financials are based on the most recent Mortgage that was taken out on this home.
Original Mortgage
$194,572
Interest Rate
6.99%
Mortgage Type
New Conventional
Create a Home Valuation Report for This Property
The Home Valuation Report is an in-depth analysis detailing your home's value as well as a comparison with similar homes in the area
Home Values in the Area
Average Home Value in this Area
Purchase History
| Date | Buyer | Sale Price | Title Company |
|---|---|---|---|
| Whitfield Melanie L | $220,000 | -- | |
| Mcbride David | -- | -- | |
| Mcbridge David | $243,300 | -- |
Source: Public Records
Mortgage History
| Date | Status | Borrower | Loan Amount |
|---|---|---|---|
| Open | Whitfield Melanie L | $209,000 | |
| Previous Owner | Mcbridge David | $194,572 |
Source: Public Records
Tax History Compared to Growth
Tax History
| Year | Tax Paid | Tax Assessment Tax Assessment Total Assessment is a certain percentage of the fair market value that is determined by local assessors to be the total taxable value of land and additions on the property. | Land | Improvement |
|---|---|---|---|---|
| 2025 | $4,738 | $196,156 | $40,000 | $156,156 |
| 2024 | $4,659 | $192,356 | $40,000 | $152,356 |
| 2023 | $3,638 | $170,280 | $36,000 | $134,280 |
| 2022 | $4,020 | $161,500 | $36,000 | $125,500 |
| 2021 | $3,195 | $123,800 | $30,000 | $93,800 |
| 2020 | $3,195 | $123,800 | $30,000 | $93,800 |
| 2019 | $2,954 | $112,808 | $30,000 | $82,808 |
| 2018 | $2,954 | $112,808 | $30,000 | $82,808 |
| 2017 | $2,508 | $98,176 | $32,000 | $66,176 |
| 2016 | $2,510 | $98,176 | $32,000 | $66,176 |
| 2015 | $2,427 | $91,692 | $32,000 | $59,692 |
| 2014 | $2,447 | $91,692 | $0 | $0 |
Source: Public Records
Map
Nearby Homes
- 5344 Saint Martins Ct SE
- 56 Cooper Lake Rd SW
- 55 Cooper Lake Rd SW
- 235 Saint Martins Dr SE
- 5724 Vinings Retreat Way SW
- 5511 Vinings Lake Ln SW
- 5731 Vinings Retreat Way SW
- 70 Driskell Ave SW
- 282 Vinings Retreat View SW
- 144 Bobs Dr SW
- 4512 Sweetlake Ct SW
- Sawyer-Townhome Plan at Morris Mills - Hometown Series
- Russell Plan at Morris Mills - Hometown Series
- Jasper-Townhome Plan at Morris Mills - Hometown Series
- 144 Morris Rd SW
- 5300 Timbo Ln SW
- 71 Anita Place SE
- 6058 Knickerbocker St
- 6054 Knickerbocker St
- 5308 Vinings Lake View SW
- 5304 Vinings Lake Dr
- 5304 Vinings Lake View SW
- 5304 Vinings Lake View SW
- 5310 Vinings Lake View SW
- 5302 Vinings Lake View SW Unit 1
- 5312 Vinings Lake View SW
- 5305 Vinings Lake View SW
- 5349 Saint Martins Ct SE Unit 6
- 5301 Vinings Lake View SW Unit 1
- 5309 Vinings Lake View SW
- 5314 Vinings Lake View SW
- 5347 Saint Martins Ct SE
- 5303 Vinings Lake View SW Unit 1
- 5311 Vinings Lake View SW Unit 1
- 5316 Vinings Lake View SW Unit 1
- 5316 Vinings Lake View SW
- 157 Vinings Lake Ct SW
- 5350 Saint Martins Ct SE
- 157 Vinings Lake Ct SW